
USD/INR remains lower as RBI’s intervention supports Indian Rupee
- The Indian Rupee trades firmly against the US Dollar near 90.00 at the start of the week.
- The RBI has intervened to support the Indian Rupee, and FIIs have remained net buyers in the December 17-19 period.
- Fed’s Hammack stresses against further interest rate cuts, citing that November’s CPI data was distorted.
The Indian Rupee (INR) holds onto last week’s gains against the US Dollar (USD) at the start of the week. The USD/INR pair clings to losses near 90.00, driven by the Reserve Bank of India’s (RBI) intervention in the spot and non-deliverable forward (NDF) market to support the Indian Rupee.
Last week, the RBI sold US Dollars in the opening trade on Wednesday and in closing trading hours on Friday to cushion the Indian Rupee against its one-way depreciation against the USD. The Indian currency has declined almost 6.5%, so far this year, against the US Dollar.
The major drivers behind strength in the USD/INR this year are strong demand for US Dollars by Indian importers and the continuous outflow of foreign funds from the Indian stock market amid trade frictions between the United States (US) and India.
In the cash market, Foreign Institutional Investors (FIIs) have remained net sellers in seven out of 11 months this year. So far this month, FIIs have also offloaded their stake worth Rs. 19,857.37 crore. However, some buying has been seen among overseas investors in the last three trading days. FIIs have remained net buyers in only the past three trading days this month, and have bought a stake worth Rs. 3,598.38 crore.
The table below shows the percentage change of Indian Rupee (INR) against listed major currencies last 7 days. Indian Rupee was the strongest against the Japanese Yen.
| USD | EUR | GBP | JPY | CAD | AUD | INR | CHF | |
|---|---|---|---|---|---|---|---|---|
| USD | 0.09% | -0.25% | 1.02% | 0.08% | 0.15% | -1.06% | -0.16% | |
| EUR | -0.09% | -0.34% | 0.92% | -0.02% | 0.08% | -0.96% | -0.25% | |
| GBP | 0.25% | 0.34% | 1.37% | 0.33% | 0.41% | -0.64% | 0.08% | |
| JPY | -1.02% | -0.92% | -1.37% | -0.93% | -0.85% | -1.73% | -0.95% | |
| CAD | -0.08% | 0.02% | -0.33% | 0.93% | 0.07% | -0.79% | -0.09% | |
| AUD | -0.15% | -0.08% | -0.41% | 0.85% | -0.07% | -0.87% | -0.33% | |
| INR | 1.06% | 0.96% | 0.64% | 1.73% | 0.79% | 0.87% | 0.72% | |
| CHF | 0.16% | 0.25% | -0.08% | 0.95% | 0.09% | 0.33% | -0.72% |
The heat map shows percentage changes of major currencies against each other. The base currency is picked from the left column, while the quote currency is picked from the top row. For example, if you pick the Indian Rupee from the left column and move along the horizontal line to the US Dollar, the percentage change displayed in the box will represent INR (base)/USD (quote).
Daily Digest Market Movers: Investors shift focus to flash US Q3 GDP data
- The US Dollar struggles to regain ground against the Indian Rupee after posting a fresh three-week low near 89.50 on Friday, even as the former trades broadly stable against its major peers amid expectations that the Federal Reserve (Fed) will not cut interest rates in its January policy meeting.
- At the time of writing, the US Dollar Index (DXY), which tracks the Greenback’s value against six major currencies, trades marginally lower around 98.60.
- According to the CME FedWatch tool, the probability of the Fed reducing interest rates by 25 basis points (bps) to 3.25%-3.50% in the January meeting is 22.5%.
- Fed dovish expectations for the January meeting have not accelerated despite the US Consumer Price Index (CPI) data for November showing that inflationary pressure cooled down.
- The data on Thursday showed that the headline inflation cooled down to 2.7% year-on-year (YoY) from 3% in October. In the same period, the core CPI – which strips off volatile food and energy items – cooled down to 2.6% from estimates and the prior reading of 3%.
- Over the weekend, Cleveland Fed President Beth Hammack stated in a podcast interview with the Wall Street Journal (WSJ) that there is no need to change interest rates at least until the spring, while stressing the need for evidence supporting progress in inflation towards 2%. She added that the significance of November’s inflation reading is limited as the data was distorted due to the government shutdown.
- “My base case is that we can stay here for some period of time, until we get clearer evidence that either inflation is coming back down to target or the employment side is weakening more materially,” Hammack said.
- Going forward, the major trigger for the US Dollar will be the preliminary Q3 Gross Domestic Product (GDP) data, which will be published on Tuesday.
Technical Analysis: USD/INR sees immediate support near 89.10
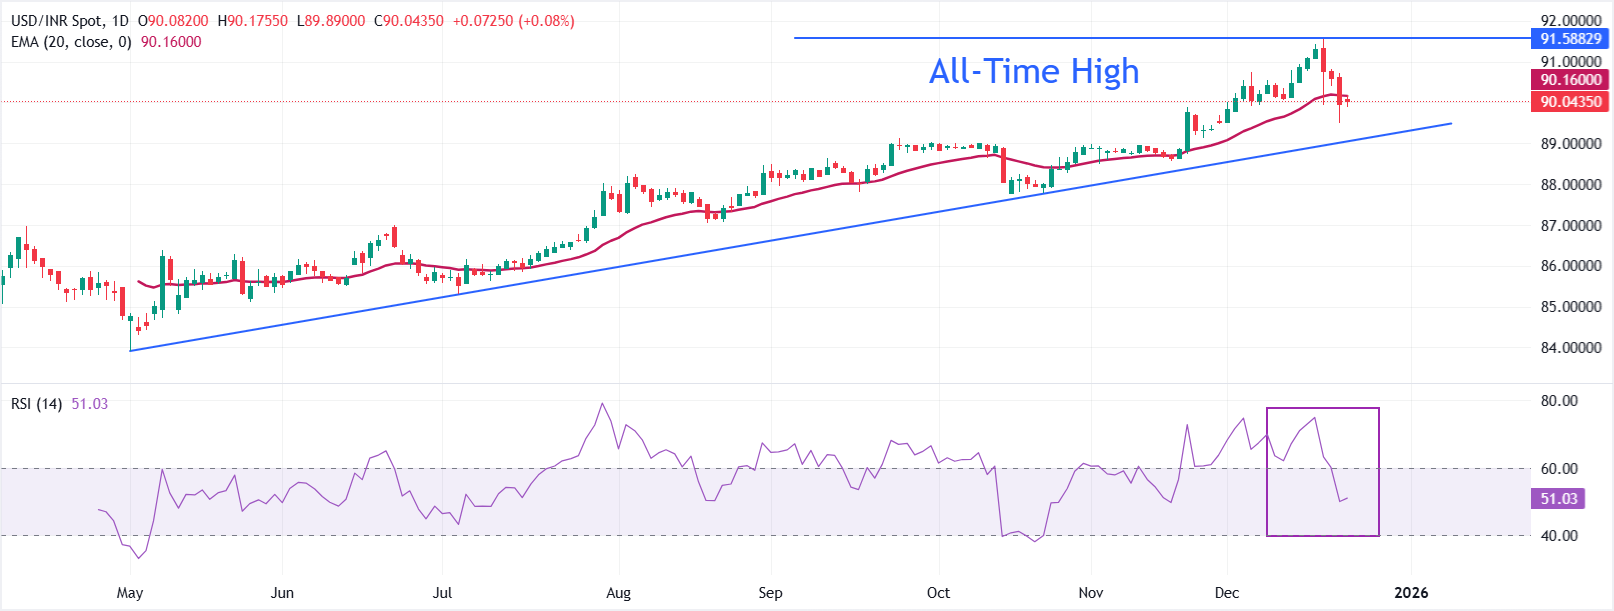
USD/INR trades cautiously near 90.0440 at the start of the week. The 20-day Exponential Moving Average rises, though price has slipped marginally below it at 90.1601, tempering near-term upside after a firm climb. The rising trend line from 83.9122 underpins the broader bias, with support aligned near 89.1107.
The 14-day Relative Strength Index (RSI) at 51 (neutral) confirms momentum has cooled from recent overbought readings.
Upside traction would improve on a sustained close back above the 20-day EMA that could press the price to revisit the all-time high near 91.50. Looking down, a break beneath the ascending trend line could open the door to a deeper pullback toward the November low of 88.49.
(The technical analysis of this story was written with the help of an AI tool.)
Economic Indicator
Gross Domestic Product Annualized
The real Gross Domestic Product (GDP) Annualized, released quarterly by the US Bureau of Economic Analysis, measures the value of the final goods and services produced in the United States in a given period of time. Changes in GDP are the most popular indicator of the nation’s overall economic health. The data is expressed at an annualized rate, which means that the rate has been adjusted to reflect the amount GDP would have changed over a year’s time, had it continued to grow at that specific rate. Generally speaking, a high reading is seen as bullish for the US Dollar (USD), while a low reading is seen as bearish.
Read more.Next release: Tue Dec 23, 2025 13:30 (Prel)
Frequency: Quarterly
Consensus: 3.2%
Previous: 3.8%
Source: US Bureau of Economic Analysis
The US Bureau of Economic Analysis (BEA) releases the Gross Domestic Product (GDP) growth on an annualized basis for each quarter. After publishing the first estimate, the BEA revises the data two more times, with the third release representing the final reading. Usually, the first estimate is the main market mover and a positive surprise is seen as a USD-positive development while a disappointing print is likely to weigh on the greenback. Market participants usually dismiss the second and third releases as they are generally not significant enough to meaningfully alter the growth picture.
 Copy Link
 Share on Facebook
 Share on X
 Share by Email
