
Nasdaq Technical Analysis – The Fed signals no help
Fundamental Overview
The FOMC decision didn’t provide anything new. In fact, the Fed delivered on expectations with no surprises whatsoever. The central bank kept rates steady, reduced the QT pace, revised growth lower and inflation higher, and kept the dot plot mostly unchanged.
Fed Chair Powell acknowledged the current uncertainty around Trump’s policies and the inflation outlook but confirmed that the economy remains healthy, and the Fed is in a good position to wait for more clarity.
The only noteworthy comment was the dismissal of the rise in the long-term inflation expectations in the University of Michigan Consumer Sentiment survey as he labelled it as an outlier given that other metrics show long term expectations stable or even slightly lower.
Today, we get the US Jobless Claims figures which continue to show a stable labour market but it’s worth to keep an eye on them for early signs of weakness. The next key event is scheduled for Monday when we get the US Flash PMIs which coupled with the UMich inflation expectations triggered the growth scare last month.
Nasdaq Technical Analysis – Daily Timeframe
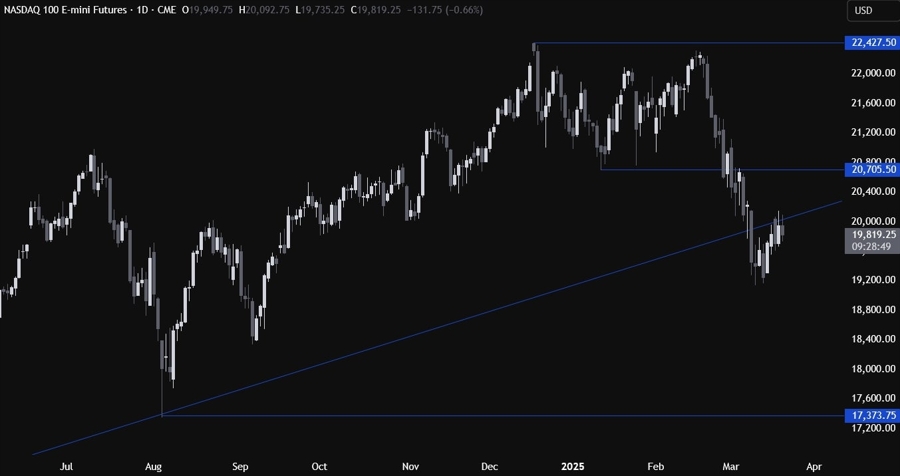
On the daily chart, we can see that the Nasdaq eventually pulled all the way back to the broken trendline. The price has been struggling to break above it as the sellers continue to pile in with a defined risk above the trendline to position for a drop into the 17373 level next. The buyers, on the other hand, will want to see the price breaking higher to gain more control and start targeting the 20705 level next.
Nasdaq Technical Analysis – 4 hour Timeframe
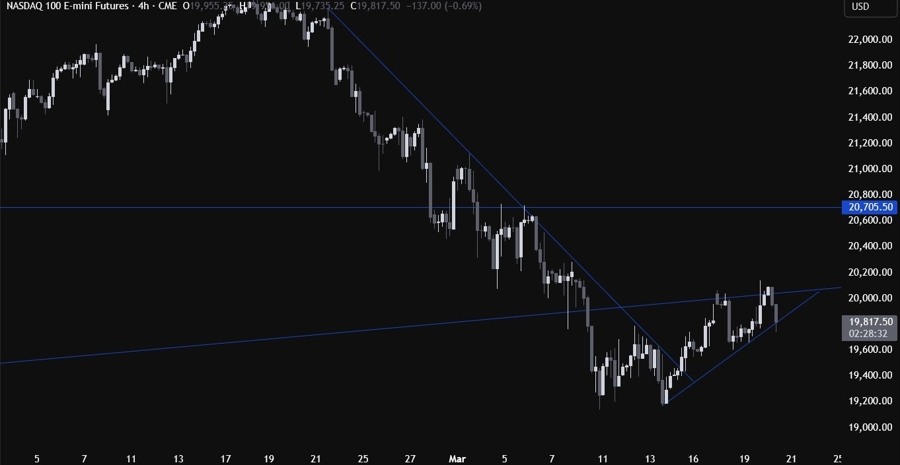
On the 4 hour chart, we can see that we have an upward trendline defining the bullish momentum on this timeframe. The buyers will likely lean on the trendline to keep pushing into new highs, while the sellers will look for a break lower to increase the bearish bets into new lows.
Nasdaq Technical Analysis – 1 hour Timeframe
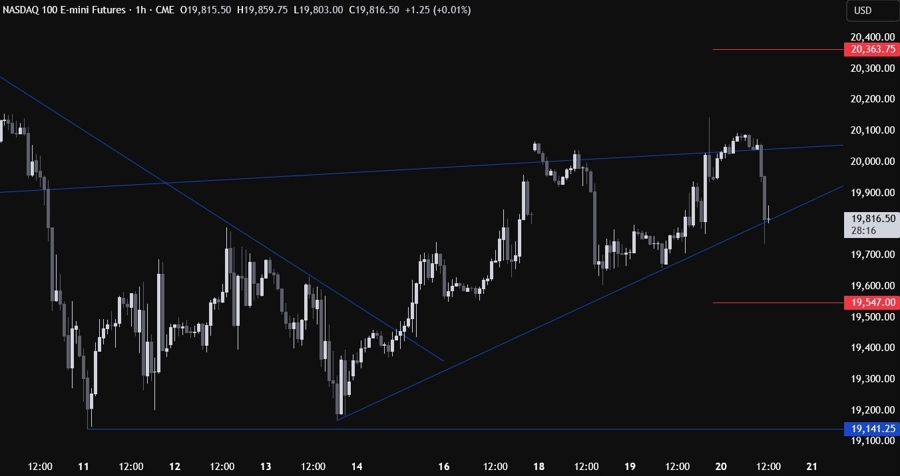
On the 1 hour chart, there’s not much we can add here as the buyers will step in around the trendline, while the sellers will continue to pile in as long as the price stays below the trendline. The red lines define the average daily range for today.
Upcoming Catalysts
Today we get the latest US Jobless Claims figures.
 Copy Link
 Share on Facebook
 Share on X
 Share by Email
