
Gold Is Surging And This New Gold Price Prediction Targets 35% Upside Above $5,500
Gold price is rising another session in a row together with the broad precious metals market, benefiting among other things from dollar weakness during the Wednesday November 26, 2025 trading session.
We're paying $4,167.47 per ounce according to spot pricing, which means a 0.85% increase compared to yesterday's close, while the yellow metal reached session highs at $4,169, the highest levels in nearly two weeks since November 14.
Why is gold going up today? The rally is primarily driven by a surge in Federal Reserve rate cut expectations for December, with odds jumping from just 50% a week earlier to over 80% currently, following a string of weak US economic data that reinforced accommodation hopes.
Moreover, some of Wall Street’s global fund managers share a bullish gold price prediction of $6,000 per ounce by year-end 2026. In this article, I analyze XAU/USD technical chart to see if it is possible.
Gold Price Today And Consolidation Between $3,900-$4,400
According to my technical analysis, the situation in the gold market has changed little over the past month, with prices moving in the same consolidation whose lower boundary marks around $3,900 per ounce and upper boundary reaches toward historical maximums just below $4,400 per ounce. This consolidation is additionally strengthened from below by the round $4,000 level and the 50-day exponential moving average, providing solid technical support.
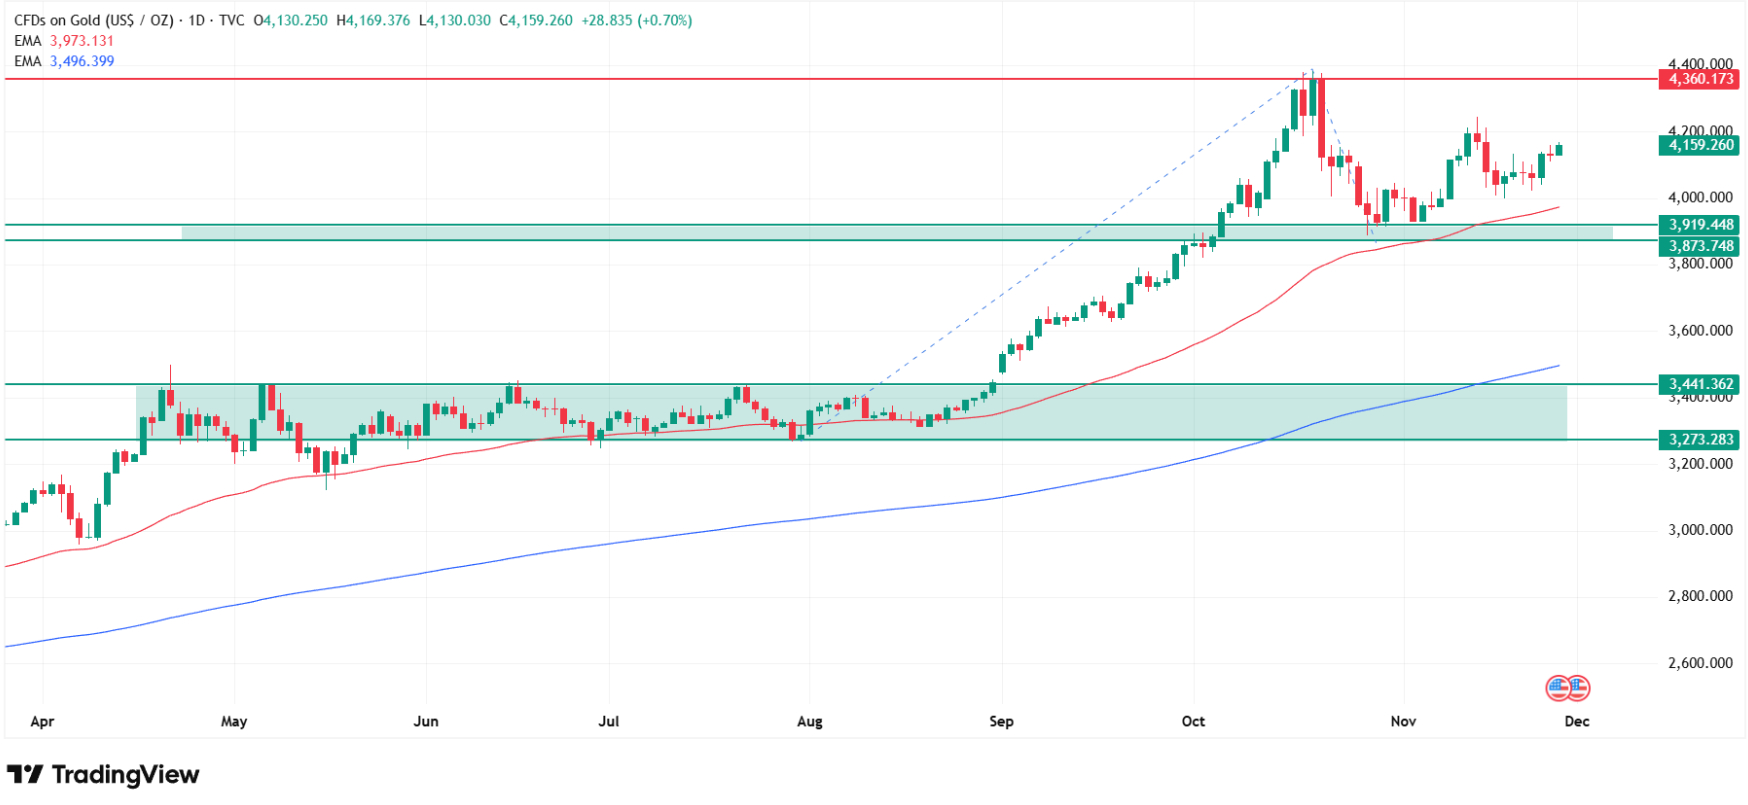
Even if this range were to be broken to the downside, I would still remain bullishly positioned on gold prices because a very wide support zone exists in the range between $3,300 and $3,450 at the height of historical peaks from April and subsequent months through July.
At this place, the 200-day exponential moving average (200 EMA) also falls, which separates the bull trend from the bear trend. So there’s quite a lot of room for a technical downward correction and then a bounce at more attractive prices.
Gold Technical Levels
Key Level | Price Zone | Technical Significance |
Current Price | $4,167 | Up 0.85%, highest since Nov 14 |
Session High | $4,169 | Two-week peak |
Consolidation Upper | $4,400 | Historical highs, resistance boundary |
Immediate Resistance | $4,200-$4,210 | Local test zone per Ryczko analysis |
Consolidation Lower | $3,900 | Support boundary, 50 EMA zone |
Round Support | $4,000 | Psychological level strengthening base |
Wide Support Zone | $3,300-$3,450 | April-July peaks + 200 EMA bull/bear line |
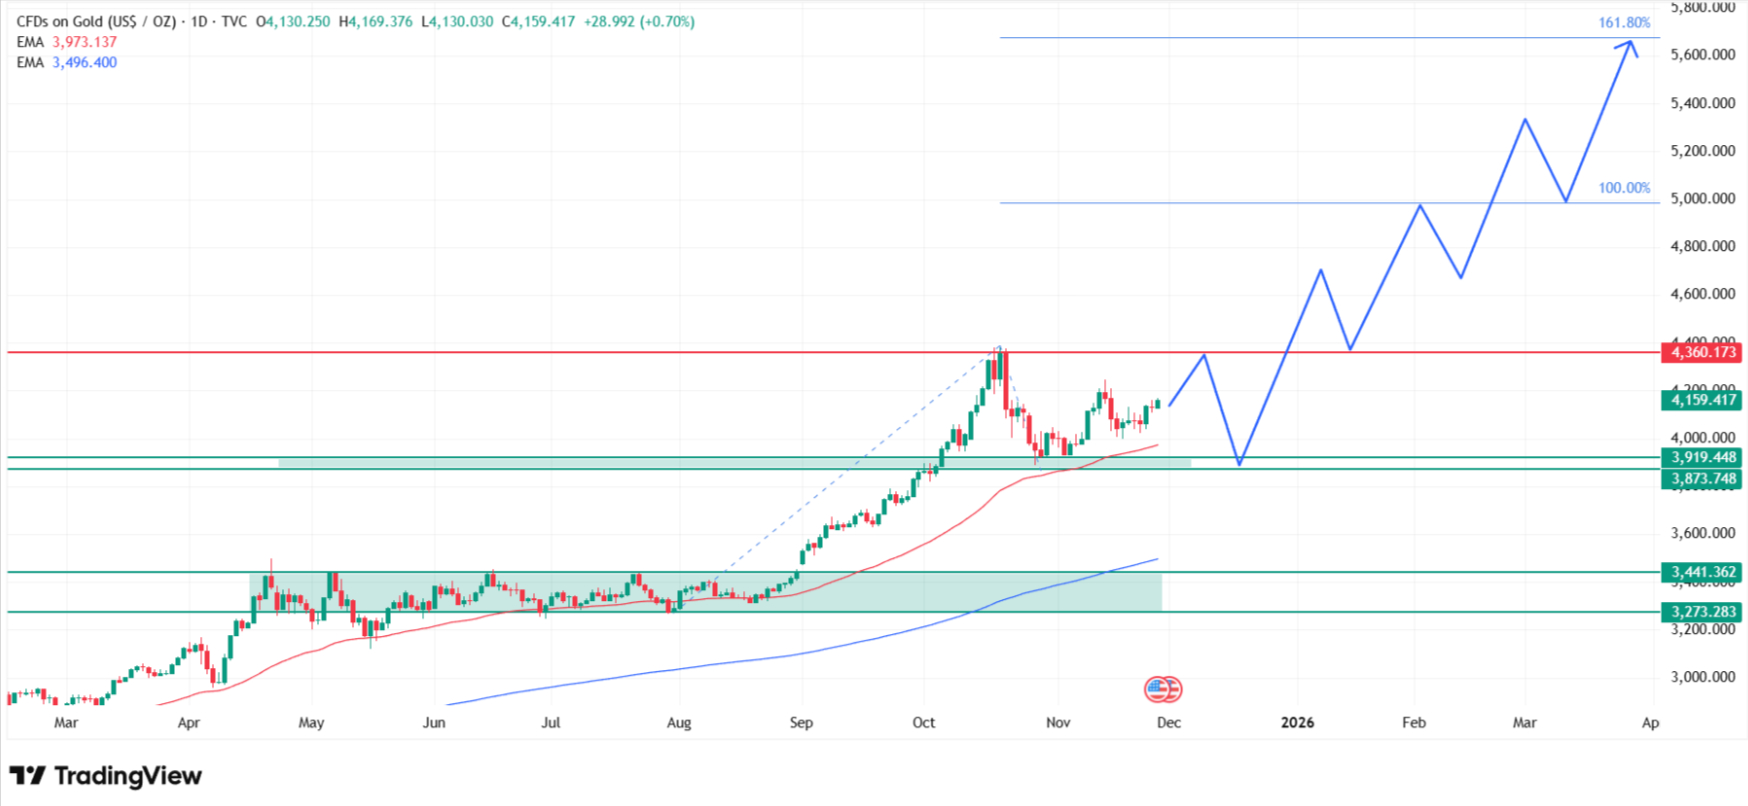
100% Fibonacci | $5,000 | Extension target from July-October move |
161.8% Fibonacci | $5,500+ | Ultimate bullish extension target |
How High Can Gold Go?
If we wanted to forecast gold's bullish scenario, it's worth using Fibonacci extensions here. In my analysis, I measured the upward move from July lows to the historical highs, then the downward correction observed at the end of October. Such measurement produces a 100% Fibonacci extension at the round $5,000 level and a 161.8% extension at a level above $5,500.
"The gold supporting factor is increasingly clear expectations for a December rate cut from the Fed, especially as yesterday's delayed macro data fell below expectations," Konrad Ryczko, analyst at DM BOŚ, commented.
"Locally there's a test of resistance at $4,200-$4,210, whose breakout would most likely open the path to approach recent peaks around $4,370," he added.
Check also my other articles and forecasts about gold market:
[#highlighted-links#]
Whether gold can reach this high as shown by the latest fund manager forecasts, this scenario is not completely excluded. Small part of wall street thinks it is possible, or to move even higher.
Why Gold Is Surging? Key Drivers
Fed Dovish Pivot Drives Precious Metals Rally
Samer Hasn, Senior Market Analyst at XS.com, explained the broader precious metals rally: "Silver rose by nearly 1% to the highest level in a week, moving beyond 52 dollars per ounce and marking a third consecutive day of gains."
- Dollar weakness: US dollar declining as rate cut odds surge, making gold more attractive
- Fed dovish pivot: December rate cut probability jumped to 80%+ from 50% week earlier
- Weak US data: Retail sales missed, Consumer Confidence 88.7 (lowest since May), modest PPI
- Federal deficit concerns: Widening deficit driving safety bid in precious metals
- Silver confirmation: Third consecutive gain to $52.08/oz validates precious metals rally
- Technical support: Gold consolidation $3,900-$4,400 holding with $4,000 + 50 EMA base
- Year-to-date gains: Gold up 57.99% YTD, past month +4.64%
The weak economic data has dramatically shifted Federal Reserve policy expectations. Traders now assign over 80% probability to a 25 basis point rate cut at the December 17-18 FOMC meeting, up sharply from just 50% odds a week earlier. This dovish pivot comes as delayed economic data, held up by the recent government shutdown, has consistently fallen below expectations, reinforcing the case for monetary accommodation.
Gold Price Prediction: 5% of Wall Street Expect $5,000+
Despite gold's strong performance, up 60% year-to-date, institutional sentiment remains surprisingly muted. The Kobeissi Letter published survey data from Bank of America revealing that "professional investors can only ignore gold for so long: Only 5% of global fund managers believe gold prices will exceed $5,000 by the end of 2026."
Professional investors can only ignore gold for so long:
— The Kobeissi Letter (@KobeissiLetter) November 23, 2025
Only 5% of global fund managers believe gold prices will exceed $5,000 by the end of 2026.
34% expect gold to trade in the $4,000 to $4,500 range, while 27% think prices will reach $4,500 to $5,000 per ounce.
On the… pic.twitter.com/yIGAnIRcK7
The survey breakdown shows:
- 34% expect gold to trade in the $4,000 to $4,500 range
- 27% think prices will reach $4,500 to $5,000 per ounce
- 34% see gold prices falling below $4,000, with 26% anticipating a range of $3,500 to $4,000
- 39% of professional investors in the survey do not own any gold in their portfolios
"Gold is also no longer 'the most crowded' trade after topping that list for the first time in October," The Kobeissi Letter noted. "Wall Street is still unconvinced about gold."
Fund Manager Gold Sentiment Survey
Price Range | Percentage of Managers | Outlook |
Above $5,000 | 5% | Ultra-bullish |
$4,500-$5,000 | 27% | Moderately bullish |
$4,000-$4,500 | 34% | Neutral to slight bullish |
$3,500-$4,000 | 26% | Moderately bearish |
Below $3,500 | 8% | Bearish |
Own No Gold | 39% | Not positioned |
This institutional skepticism stands in stark contrast to my technical analysis showing Fibonacci extension targets at $5,000 (100% extension) and above $5,500 (161.8% extension) remaining viable scenarios.
The fact that only 5% of fund managers expect prices above $5,000 while 39% own no gold at all suggests significant upside potential if positioning shifts and institutions belatedly chase the rally.
Goldman Sachs also believes in a strong gold market and suggests that precious metal can surge above $5,000 in the next year.
What Comes Next for Gold Price
The immediate focus for gold markets is the $4,200-$4,210 resistance zone identified by analyst Konrad Ryczko. A breakout above this level would likely open the path toward approaching the recent peaks around $4,370, and from there, my Fibonacci analysis suggests the round $5,000 level comes into play.
From my technical perspective, the consolidation range between $3,900 and $4,400 that has contained prices for the past month provides a healthy base for continued appreciation. The fact that this range is strengthened from below by the psychological $4,000 level and the 50-day exponential moving average gives me confidence that any pullbacks will find support.
Even more importantly, the very wide support zone between $3,300 and $3,450, where April through July historical peaks align with the 200-day EMA, means there is substantial room for technical correction without invalidating the bull trend. This provides significant downside protection and makes gold attractive on a risk/reward basis at current levels.
The December 17-18 Federal Reserve meeting will be the next major catalyst, with markets pricing in over 80% probability of a 25 basis point rate cut. If the Fed delivers as expected and maintains a dovish forward guidance, gold should benefit from continued dollar weakness and real rate considerations. Conversely, any hawkish surprise could trigger a test of the $3,900 consolidation lower boundary.
Gold Price Analysis, FAQ
Why is gold surging today?
Gold is surging to $4,167 per ounce (+0.85%) on November 26, 2025 due to dollar weakness and Federal Reserve rate cut expectations surging to over 80% for December from 50% a week earlier.
What is gold price prediction for 2025-2026?
Gold has targets at $5,000 (100% extension) and above $5,500 (161.8% extension) measured from July lows to October highs. Analyst Konrad Ryczko sees immediate resistance test at $4,200-$4,210 with breakout opening path to $4,370 recent peaks.
Can gold reach $5,000?
Yes, according to my Fibonacci extension analysis, gold's 100% extension target from July-October move points to round $5,000 level, with 161.8% extension above $5,500. However, only 5% of global fund managers in Kobeissi Letter survey believe gold will exceed $5,000 by end of 2026, while 39% own no gold at all.
Will gold continue to rise?
Yes. Gold's continued rise depends on Federal Reserve December 17-18 meeting outcome (80%+ probability of 25bp cut priced in), dollar trajectory, and US economic data.
How high can gold go?
Gold has technical targets at $5,000 (100% extension from July-October move) and above $5,500 (161.8% extension). However, Kobeissi Letter survey reveals only 5% of global fund managers expect above $5,000 by end 2026.
 Copy Link
 Share on Facebook
 Share on X
 Share by Email
