
How Low Can Bitcoin Go? This New BTC Price Prediction Suggests Death Cross May Push it 30% Down to $74,000
Bitcoin (BTC) price is flashing warning signals today (Tuesday(, November 11, 2025, after rejecting key resistance at $107,482 and falling back to $105,296.69, down 0.64% on the session.
According to my technical analysis, based on my 10-year experience as a trader and analyst, the cryptocurrency faces a potentially severe correction scenario, with the $100,000 level representing the last line of defense for bulls before a possible 30% plunge to $74,000.
Let’s check together how low can Bitcoin price go and what are the newest BTC price predictions for the reamning of 2025.
Bitcoin Price Prediction: Death Cross Warning: Critical Technical Signal Forming
Bitcoin's price on Tuesday, November 11, 2025, stalled at the resistance level determined by the 38.2% Fibonacci retracement, 200 EMA, and the $107,000 level marking lows from early October. The intraday high was drawn at $107,500, but at the time of writing, BTC is falling 0.7% and trading at $105,325.
According to my technical analysis, the $100,000 level currently represents the last line of defense for bulls, combined with the 50% Fibonacci retracement. The 50 EMA is close to crossing the 200 EMA from above, generating the so-called death cross, a very strong sell signal. In this scenario, I would expect BTC price could fall to as low as $74,000, matching the April lows and representing a 30% decline from current levels.
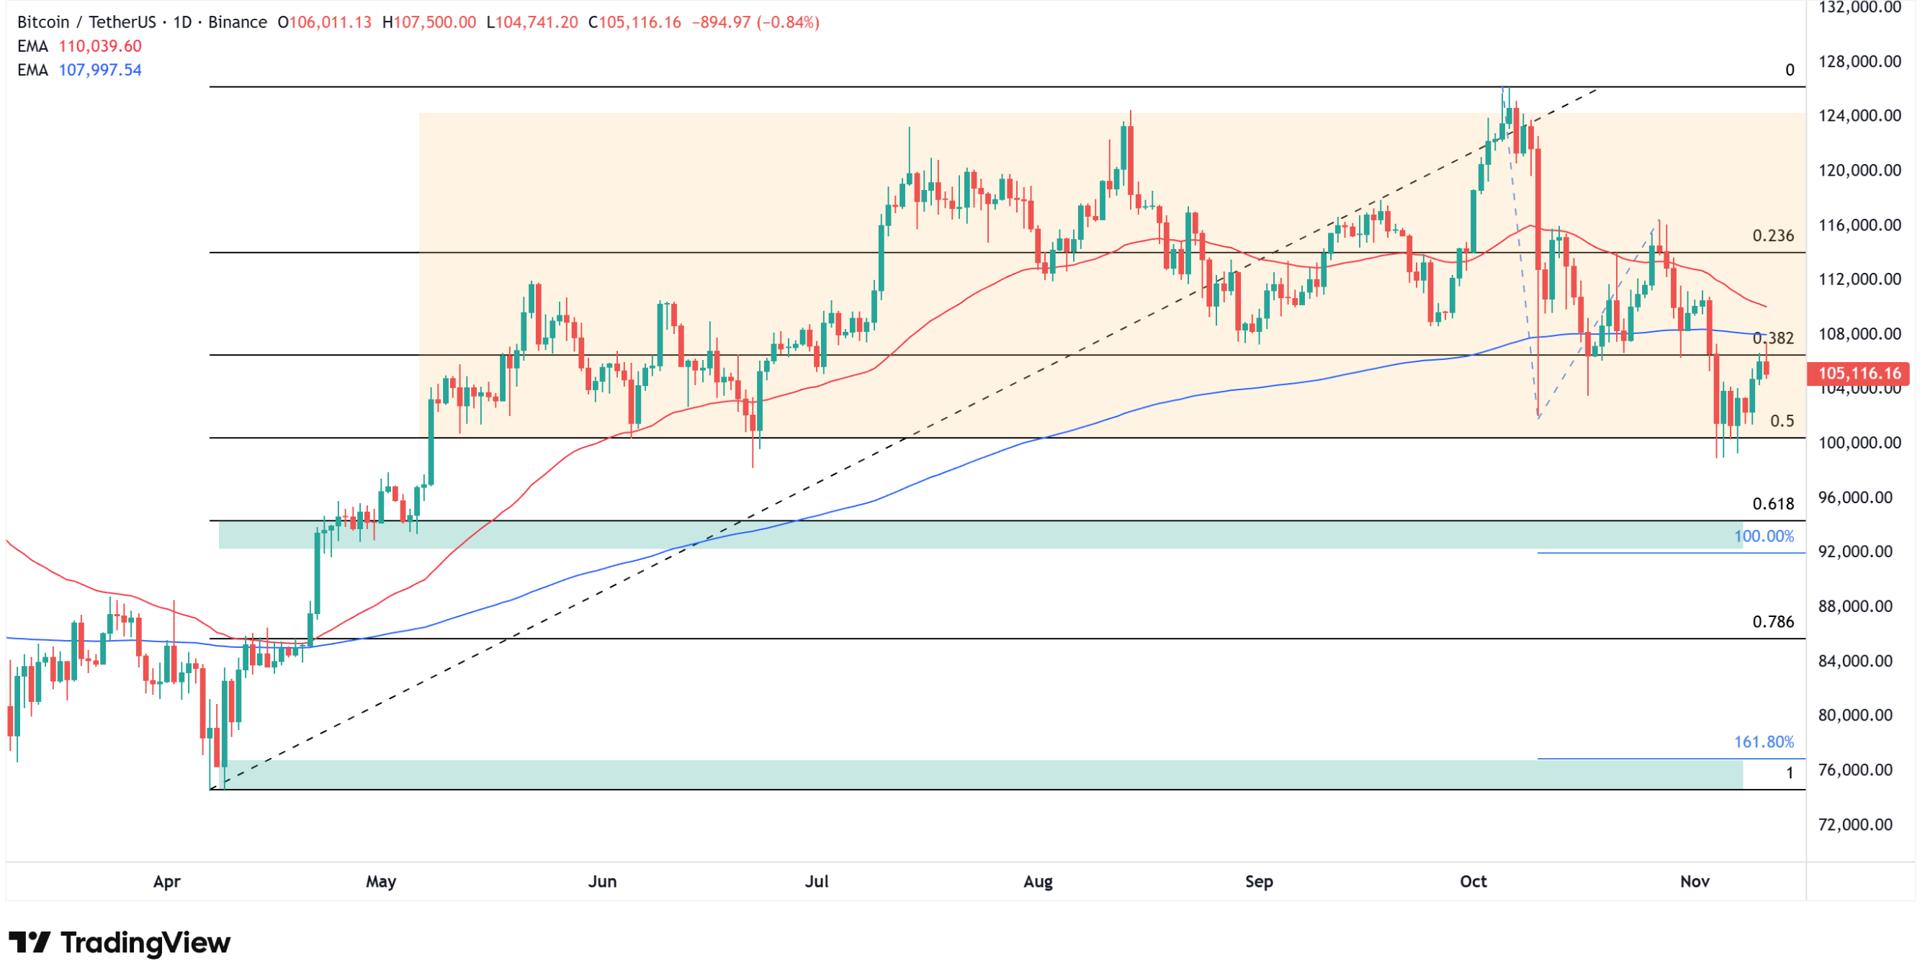
The death cross pattern occurs when the shorter-term 50-day exponential moving average crosses below the longer-term 200-day EMA, signaling momentum has shifted decisively bearish. Bitcoin's 50-day MA currently sits at $111,864 while the 200-day MA is at $110,364, a narrowing gap that suggests the crossover could occur within days.
Paul Howard, Director at Wincent, highlighted the deteriorating sentiment: "Fears of a collapse has filtered into the risk sentiment. Cryptocurrency prices seem to have abated owing to US economic sentiment improving with regards to risks from tariffs and the cessation of government shutdown. $100,000 remains the key resistance level for BTC where we see strong interest from institutional buyers."
Please also take a look at my previous Bitcoin price predictions:
[#highlighted-links#]
How Low Can BTC GO? Three Critical Support Levels on Path Lower
Along the way, I identify a short-term support zone between $92,000-$94,000 strengthened by the 61.8% Fibonacci retracement and early May lows. This intermediate level represents approximately 12-14% downside from current prices and could provide temporary relief if $100,000 support breaks.
The most severe scenario targets $74,000, which would match Bitcoin's year low of $74,420.69 established in April 2025. This represents a 30% decline from current levels and would erase nearly all gains accumulated since spring. The April lows marked a critical accumulation zone where institutional buyers aggressively entered positions, making this level particularly significant as ultimate support.
Invalidation of my bearish scenario would be a return above the 200 and 50 EMAs, which would free Bitcoin from bearish pressure and potentially open the path back toward the October all-time high of $126,080. However, with price currently trading below both moving averages and technical indicators deteriorating, the probability favors further downside.
"The market is in a correction phase, and on-chain flows clearly show this. Analysis of the on-chain Cost Basis Distribution indicator from Glassnode shows levels where positions in Bitcoin are being built or closed on a large scale,” XTB analyst emphasized the on-chain evidence supporting correction:
Market Sentiment Turns Fearful
Technical indicators paint an increasingly bearish picture beyond just the impending death cross. The Fear & Greed Index has plunged to 29, firmly in "Fear" territory, reflecting growing anxiety among cryptocurrency investors. This represents a dramatic shift from the euphoric sentiment that drove Bitcoin to its October record high above $126,000.
Bitcoin's Relative Strength Index (RSI) sits at 44.46, hovering in neutral territory but trending lower. The cryptocurrency has posted only 50% green days over the past 30 trading sessions, and bearish sentiment has climbed to 36% among market participants. These metrics suggest conviction among bulls is wavering as the rally loses steam.
"The lack of major catalysts and mixed macro signals has kept investors cautious, though underlying sentiment remains constructive following last week's stabilization across digital assets. Price action continues to be influenced by traditional market dynamics, particularly expectations for U.S. rate cuts and fluctuations in the dollar,” Joel Kruger, crypto strategist at LMAX, provides broader context for the weakness:
Why Bitcoin Will Fall Down? Macro Headwinds and Mixed Signals
Kruger continued: "The combination of softer U.S. labor data and tentative progress in Washington's political negotiations has tempered risk appetite, but it has also strengthened the medium-term case for easier policy, a backdrop typically favorable for crypto. Meanwhile, geopolitical tensions remain a wildcard, with investors closely monitoring developments in trade and energy markets for potential spillover effects on global liquidity and sentiment."
The Federal Reserve's monetary policy path remains a critical variable. While the probability of a December rate cut sits above 64%, Fed speakers have emphasized the need to "go slow" in cutting rates, creating uncertainty about the pace of easing. Lower rates typically benefit non-yielding assets like Bitcoin by reducing opportunity cost, but the slower-than-expected easing trajectory has dampened enthusiasm.
Dollar fluctuations add another layer of complexity. Bitcoin typically moves inversely to the U.S. Dollar Index, but improved economic sentiment regarding tariff risks and the government shutdown resolution has provided temporary support to the greenback, creating headwinds for crypto.
The cryptocurrency remains more than 16% below its October peak of $126,080, having officially entered bear market territory (defined as a 20% decline from highs) during last week's selloff. While Monday's brief Senate shutdown rally pushed Bitcoin above $106,000, the cryptocurrency has failed to build on those gains, suggesting the bounce was more technical relief than fundamental reversal.
Bitcoin Price Analysis, FAQ
How low can Bitcoin go in 2025?
According to my technical analysis, Bitcoin could fall to $74,000 if the $100,000 support level breaks, representing a 30% decline from current levels around $105,296. This target matches the April 2025 year low of $74,420.69 and would be triggered by confirmation of a death cross (50 EMA crossing below 200 EMA) combined with breakdown of critical support.
What is a death cross in Bitcoin and why does it matter?
A death cross occurs when Bitcoin's 50-day exponential moving average crosses below the 200-day EMA from above, signaling that shorter-term momentum has turned decisively bearish. The 50-day MA currently sits at $111,864 while the 200-day MA is at $110,364, with the crossover potentially occurring within days. This technical pattern is considered a very strong sell signal because it indicates the trend has reversed from bullish to bearish.
What are Bitcoin's key support levels right now?
Bitcoin faces three critical support zones: $100,000 (current last line of defense, combined with 50% Fibonacci retracement and institutional buying interest), $92,000-$94,000 (intermediate support strengthened by 61.8% Fibonacci retracement and early May lows), and $74,000 (April 2025 year low representing final major support).
Is Bitcoin in a bear market?
Yes, technically Bitcoin entered bear market territory by falling more than 20% from its October 2025 all-time high of $126,080. The cryptocurrency currently trades at $105,296.69, representing a 16.5% decline from the peak. While not yet a full 20% correction, Bitcoin touched levels below $100,000 last week that qualified as bear market. The Fear & Greed Index at 29 (Fear), bearish sentiment at 36%, and only 50% green days over the past 30 sessions all support the characterization of a market in correction mode.
 Copy Link
 Share on Facebook
 Share on X
 Share by Email
