
USDCHF struggles to regain upide momentum after rejection at key resistance last week
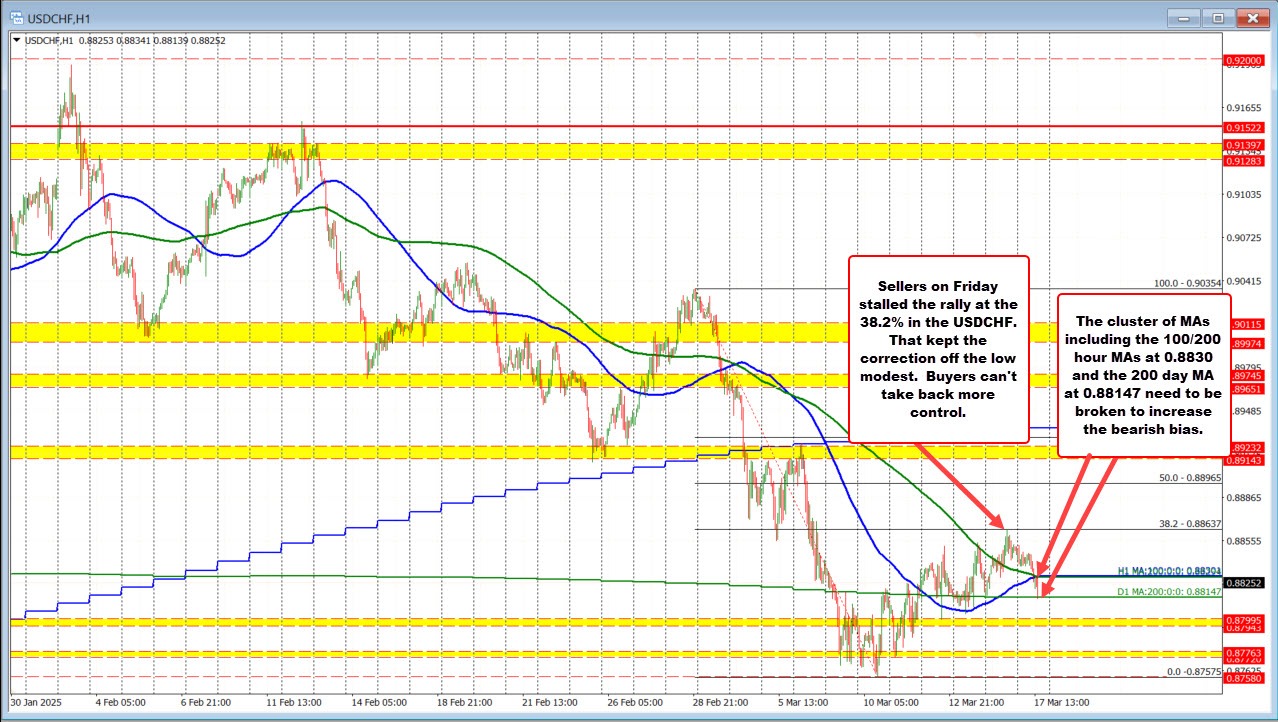
The USDCHF remains in a bearish technical posture on the hourly chart after sellers defended the 38.2% Fibonacci retracement level at 0.88637 last week. This level marks the correction of the move down from the late February high to the March low. The inability of buyers to push above this resistance level has kept downside momentum intact.
Currently, the pair is testing a critical support cluster formed by the 100-hour moving average (0.8830), the 200-hour moving average (0.8830), and the 200-day moving average (0.88147). A confirmed break below this zone would reinforce the bearish bias and open the door for further declines toward 0.8800-0.8785. If sellers manage to sustain the downside pressure below the 200-day MA, it could accelerate losses, signaling a continuation of the broader downtrend.
On the other hand, if buyers stall the fall the 200 day MA and move back above the 100/200 hour MA, the buyers remain in play and can push the price back above 0.88637, it would indicate a shift in momentum, potentially leading to a move toward the 50.0% retracement level at 0.8896.
However, as long as the price remains below the 38.2% retracement, rallies are likely to face selling interest, keeping the bearish structure intact.
 Copy Link
 Share on Facebook
 Share on X
 Share by Email
