S&P 500 Technical Analysis – Bad economic data scares the market
Fundamental Overview
The S&P 500 sold off pretty aggressively on Friday following the weak US Flash Services PMI and later the Final UMich Consumer Sentiment survey where the long-term inflation expectations jumped to a new 30-year high.
The bulk of the selloff came after the jump in the long-term inflation expectations. The market might be fearing that in case we get a slowdown, the Fed might not be fast enough in cutting rates amid inflation remaining above target and uncomfortably high long-term inflation expectations.
Of course, one single data point might not be enough to get a bigger correction in the stock market, especially since it’s from the University of Michigan survey and since we are about to see a tick lower in the Core PCE Y/Y rate to 2.6% on Friday.
Nonetheless, this is something to keep in mind in light of the next NFP and CPI reports coming out before the March FOMC decision where we will also get the updated SEP and Dot Plot.
S&P 500 Technical Analysis – Daily Timeframe

On the daily chart, we can see that the S&P 500 pulled back from the all-time highs following a couple of negative data. The sellers will likely continue to push into the closest support around the 5960 level, while the buyers will look to buy the dip around those levels to position for a rally back into the all-time highs.
S&P 500 Technical Analysis – 4 hour Timeframe

On the 4 hour chart, we can see that after the strong selloff on Friday, the price bounced near the minor support around the 6020 level as the dip buyers stepped in with a defined risk below the level to position for a rally back into the highs. The sellers, on the other hand, will look for a break lower to increase the bearish bets into the 5960 level next.
S&P 500 Technical Analysis – 1 hour Timeframe
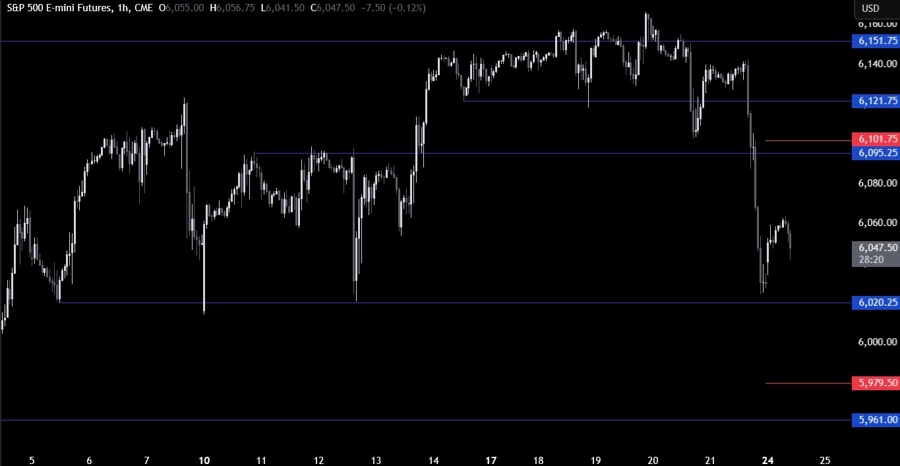
On the 1 hour chart, there’s not much else we can add here as from a risk management perspective, the buyers will have a better risk to reward setup around the 6020 support to position for new highs, while the sellers will look for a break lower to extend the drop into new lows. The red lines define the average daily range for today.
Upcoming Catalysts
Tomorrow we have the US Consumer Confidence report. On Thursday, we get the latest US Jobless Claims figures, while on Friday we conclude the week with the US PCE data.
 Copy Link
 Share on Facebook
 Share on X
 Share by Email