
AUDUSD Technical Analysis – The pair continues to mostly range
Fundamental Overview
The USD hasn’t done much since the FOMC decision as the market awaits something new to push into either direction. The Fed delivered on expectations with no surprises whatsoever. The central bank kept rates steady, reduced the QT pace, revised growth lower and inflation higher, and kept the dot plot mostly unchanged.
Fed Chair Powell acknowledged the current uncertainty around Trump’s policies and the inflation outlook but confirmed that the economy remains healthy, and the Fed is in a good position to wait for more clarity.
The only noteworthy comment was the dismissal of the rise in the long-term inflation expectations in the University of Michigan Consumer Sentiment survey as he labelled it as an outlier given that other metrics show long term expectations stable or even slightly lower.
On the AUD side, the Australian Employment report today was much weaker than expected and weighed on the Aussie Dollar. The market pricing didn’t change much though as the market continues to expect around 64 bps of easing by year end compared to 60 bps before the data.
AUDUSD Technical Analysis – Daily Timeframe

On the daily chart, we can see that AUDUSD couldn’t extend the recent rally above the 0.64 handle. The buyers will want to see the price breaking to a new high to start targeting the 0.65 handle next. For now, there’s not much we can glean from this timeframe as the pair continues to mostly range.
AUDUSD Technical Analysis – 4 hour Timeframe
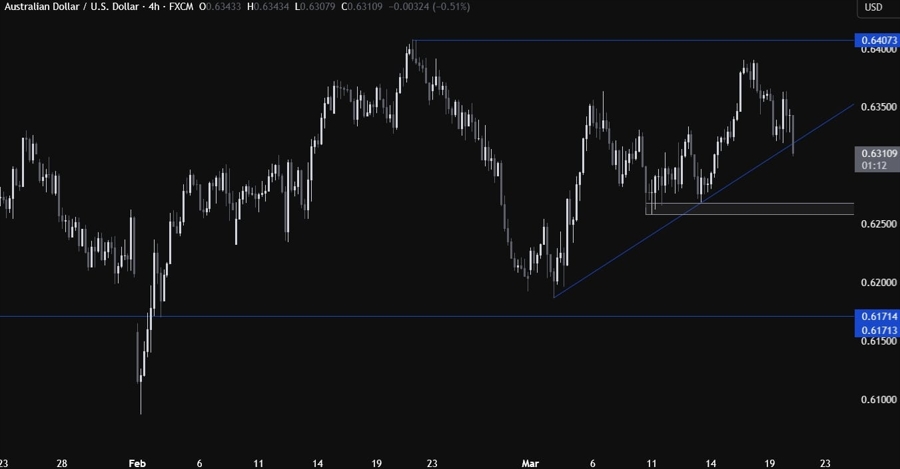
On the 4 hour chart, we can see that we had an upward trendline defining the bullish momentum. As the price broke below the trendline, the sellers piled in for a drop into the 0.6270 level. The buyers, on the other hand, will look to buy the dip around the 0.6270 level with a defined risk below the level to position for a rally into the 0.65 handle next.
AUDUSD Technical Analysis – 1 hour Timeframe
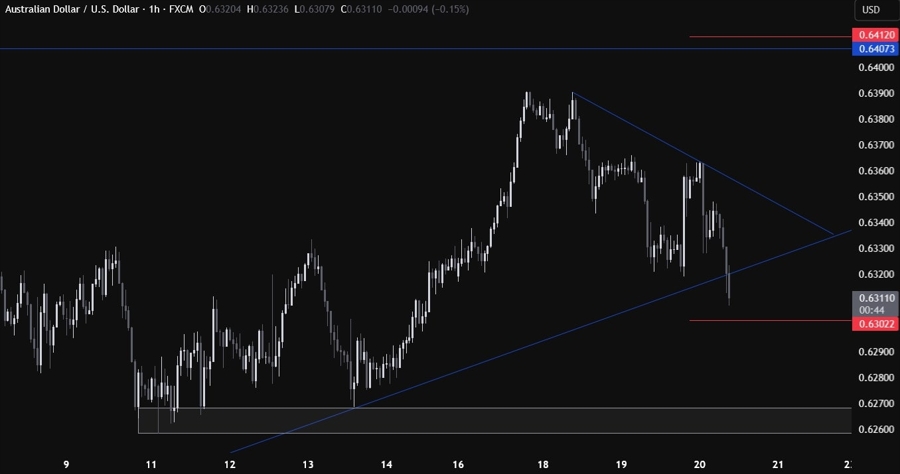
On the 1 hour chart, we can see that we have a minor downward trendline defining the current pullback into the 0.6270 support zone. If the price rallies into the trendline, we can expect the sellers to lean on it to position for the drop into the 0.6270 support with a better risk to reward setup. The buyers, on the other hand, will look for a break higher to start targeting new highs. The red lines define the average daily range for today.
Upcoming Catalysts
Today we get the latest US Jobless Claims figures.
 Copy Link
 Share on Facebook
 Share on X
 Share by Email
