
Why Gold Is Falling? New Gold Price Prediction Signals Further 17% Drop as Metal Plunges Below $4,000
Gold price plunged below the psychologically critical $4,000 level on Monday, losing over 3% after its steepest single-day decline since 2020, as investors reduced safe-haven positions following breakthrough progress in US-China trade negotiations.
The precious metal continues its retreat today (Tuesday), 28 October 2025,, down another 1% to $3,963.53 per ounce, marking a three-week low and the first sustained move below $4,000 since the October rally stalled.
In this article, I explore why the price of gold is going down, conduct a technical analysis of the XAU/USDT chart, and identify a key support zone, suggesting that gold may correct by another 17%.
Why Gold Price Is Going Down Today?
The selloff accelerated over the weekend as US and Chinese negotiators meeting during the ASEAN conference in Malaysia hammered out a framework agreement that eliminates the threat of 100% US tariffs on Chinese goods and secures a one-year delay on rare earth export restrictions.
Treasury Secretary Scott Bessent stated the proposed tariffs are "off the table," dramatically reducing the geopolitical risk premium that had propelled gold to record highs above $4,380 just days earlier.
Gold Price Decline Metrics | Data (Oct 28, 2025) |
Current Spot Price | $3,963.53/oz |
Daily Change | -$18.00 (-0.45%) |
Monday's Plunge | -3.0% |
Year-High (Oct 17-19) | $4,381.58/oz |
Decline from Peak | -9.5% |
Year-to-Date Gain | +42.83% |
Support Target | $3,830 (50 EMA) |
"Gold is losing due to decreasing risk regarding international trade, while simultaneously reacting to recent moves from ETF funds,” Michał Stajniak, Deputy Chief Analyst at XTB, explained the catalyst for gold's decline. “During the ASEAN conference in Malaysia, a meeting between Chinese and American negotiators produced a working agreement that eliminates the risk of 100% tariffs on Chinese products and is meant to reduce rare earth export restrictions from China to the USA."
[#highlighted-links#]
How Low Can Gold Go? Technical Breakdown Below $4,000 Triggers Selloff
According to my technical analysis, gold is realizing profits after testing historical maximums around the $4,380 per ounce level, where it remained from October 17 to 19. On October 19, there was a strong single-day correction, the strongest since 2020, which triggered a wave of selling and ultimately pushed prices below the psychological threshold of $4,000 per ounce, after gold slid sharply again on Monday, losing over 3%.
Tuesday's session brings a continuation of declines, with gold currently down 1% and testing the $3,942 level. Where can gold head from here? According to my forecasts based on technical analysis, the first target level for declines will be the 50 EMA located currently around the $3,830 level.
The main technical support, however, remains the zone of historical highs drawn from April through the end of August, between $3,270 and $3,440 per ounce. Simultaneously, the 200 EMA falls in this location, creating a strong reaccumulation zone and confluence of supports. Gold has approximately 17% downside to the lower boundary of this range from current levels.
And although this would be a strong correction that we haven't seen in a long time, I would use this as an opportunity to buy at more attractive prices, rather than as a reason to panic. Everything above the blue 200 EMA is still an uptrend.
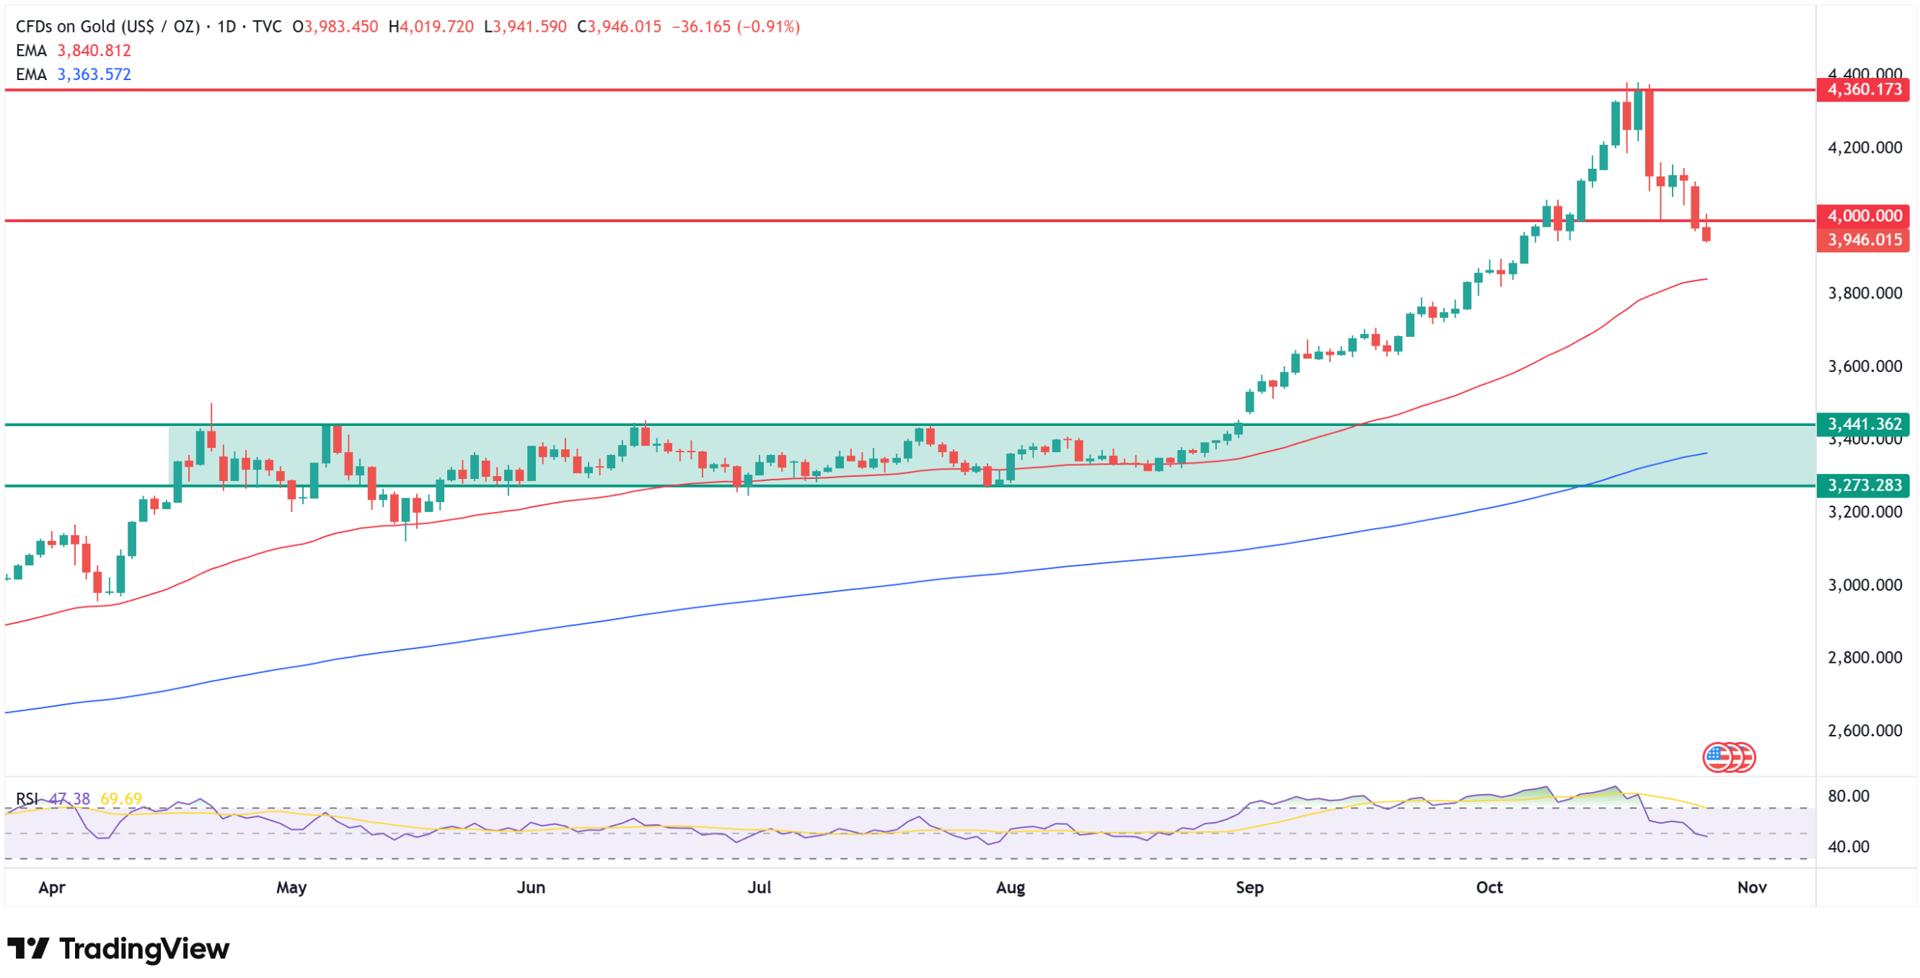
Such a decline would also allow the RSI indicator to reset, which has been moving in the overbought zone for a long time and hasn't been in the oversold zone for many long months, which would support a buy signal in the range I've marked in green on the chart.
ETF Outflows Amplify Profit-Taking Pressure
Stajniak highlighted the role of institutional flows in accelerating the decline: "Friday also saw the largest gold sales on the market among ETF funds since May. Last week also brought the first weekly decline since the second week of August." The combination of reducing geopolitical risk premiums and institutional profit-taking after gold's extended rally to record highs created powerful selling pressure that overwhelmed traditional support levels.
However, Marek Rogalski, Chief FX Analyst at BossaFX, noted that the technical damage remains limited thus far: "Nevertheless, declines in precious metal futures are not that large, the market has not retested the lows from October 22 at $4,021. At the same time, we remain above the $4,000 barrier."
This suggests the correction may represent healthy profit-taking rather than a fundamental reversal of gold's long-term bull market.
In the coming days, an interesting topic for gold will be the Fed's announcement on Wednesday, according to Rogalski. "The rate cut is certain, and the Reserve will most likely also deliver a 'dovish' message boosting expectations for further reductions. This traditionally helped gold prices. Similarly, one could interpret potential news about the end of the government shutdown, which has already lasted 27 days (we are therefore decidedly closer to its end)."
Markets are pricing a 98.3% probability of a 25-basis-point rate cut at Wednesday's Federal Reserve meeting, with another reduction expected in December. Lower interest rates typically support gold by reducing the opportunity cost of holding non-yielding assets and weakening the dollar. The dollar index showed minimal strength at -0.1%, indicating the precious metal's decline stems primarily from reduced safe-haven demand rather than currency dynamics.
Gold Price Prediction
Technical Targets Point to $3,830 and $3,270-$3,440 Zone
Based on my technical projections, the immediate downside target sits at the 50-day exponential moving average around $3,830, representing approximately 3.4% further decline from current levels. This moving average has provided dynamic support during previous pullbacks and would represent the first meaningful technical test during this correction.
The more significant support zone stretches from $3,270 to $3,440, the range of historical highs established from April through August before gold's final surge to record levels. This zone coincides with the 200-day exponential moving average, creating a powerful confluence of technical, psychological, and historical support. A decline to this range would represent approximately 17% downside from current $3,963 levels.
However, I would interpret such a move as a buying opportunity at more attractive prices rather than a reason for panic. Everything trading above the blue 200 EMA maintains the definition of an uptrend in classical technical analysis. The extended period with RSI in overbought territory without visiting oversold zones suggests a healthy reset would actually strengthen the bull case by clearing excessive positioning and allowing fresh accumulation.
Bullish Gold Price Forecasts
While gold's near-term decline has captured headlines, not everybody believes the precious metal's bull market has ended. Major financial institutions released updated forecasts last week maintaining strongly bullish outlooks for 2026, viewing the current correction as a healthy consolidation rather than a trend reversal.
A Reuters poll of 39 analysts and traders published Monday showed the median forecast for 2026 rising to $4,275 per ounce, up sharply from $3,400 projected just three months ago in July. This represents the first time annual average gold forecasts have exceeded $4,000, reflecting analyst conviction that structural demand drivers remain intact despite short-term profit-taking.
Major Institution Gold Price Forecasts Table
Institution | Q4 2025 Target | 2026 Average | 2026 Peak Target | Long-Term Target | Date Updated |
JP Morgan | $3,675/oz | $5,055/oz (Q4 2026) | — | $6,000/oz by 2028 | October 23, 2025 |
Goldman Sachs | — | — | — | October 7, 2025 | |
Morgan Stanley | — | $4,400/oz | — | — | October 21, 2025 |
Reuters Poll (39 analysts) | — | $4,275/oz | — | — | October 27, 2025 |
Metals Focus | — | $5,000/oz | — | — | October 26, 2025 |
Trading Economics | $4,157/oz | — | $4,361/oz (12 months) | — | October 27, 2025 |
Standard Chartered | — | $4,488/oz | — | — | October 13, 2025 |
Bank of America | — | $4,400/oz | $5,000/oz (end 2026) | — | October 13, 2025 |
JP Morgan delivered the most bullish update last Thursday, forecasting gold could average $5,055 per ounce by Q4 2026, underpinned by expectations that investor interest and central bank purchases will average approximately 566 tons each quarter throughout 2026. Natasha Kaneva, head of Global Commodities Strategy at JP Morgan, stated: "Gold remains our conviction long for the year. We see upside as the market enters the Fed rate-cutting cycle."
JP Morgan reaffirmed a long-term price target of $6,000 per ounce by 2028, urging investors to adopt a multi-year perspective. Gregory Shearer, head of Base & Precious Metals Strategy, noted that "the anticipated combination of a Federal Reserve cutting cycle, along with fears of stagflation, worries about Fed independence, and broader hedging against currency debasement, bolsters gold's potential for growth".
Gold Prices, FAQ
Why is gold falling today?
Gold dropped below $4,000 (-0.45% to $3,963.53) following Monday's 3% plunge triggered by US-China trade framework agreement announced at ASEAN conference in Malaysia eliminating 100% tariff threat and securing one-year rare earth export restriction delay, with Treasury Secretary Bessent stating proposed tariffs "off the table," reducing safe-haven demand as investors rotated capital to equities rallying on Wall Street.
How low can gold prices go?
According to my technical analysis, first downside target sits at 50 EMA around $3,830 (3.4% further decline), with main support zone between $3,270-$3,440 (17% downside) representing April-August historical highs coinciding with 200-day EMA creating strong reaccumulation confluence, though Trading Economics maintains Q4 forecast $4,157 and 12-month target $4,361 suggesting correction not reversal.
Is gold correction over or just starting?
Gold experienced largest ETF outflows since May on Friday and first weekly decline since second week of August following ten-week winning streak (+28% from $3,400s to $4,380), with Monday's 3% plunge potentially marking capitulation though Marek Rogalski (BossaFX) notes futures haven't retested October 22 lows at $4,021 and prices remain "above $4,000 barrier" suggesting limited technical damage thus far.
Should I sell gold now?
No. Despite 9.5% decline from October 19 peak at $4,381, gold remains +42.83% year-to-date and +49.65% year-over-year, with my technical analysis identifying $3,270-$3,440 zone (200 EMA confluence) as buying opportunity at attractive prices rather than panic-selling zone since "everything above blue 200 EMA is still an uptrend," while Fed rate cut Wednesday (98.3% probability) and potential RSI reset to oversold would support buy signals.
 Copy Link
 Share on Facebook
 Share on X
 Share by Email
