
So much for the USDCAD bullish shift above MAs on the 4-hour chart
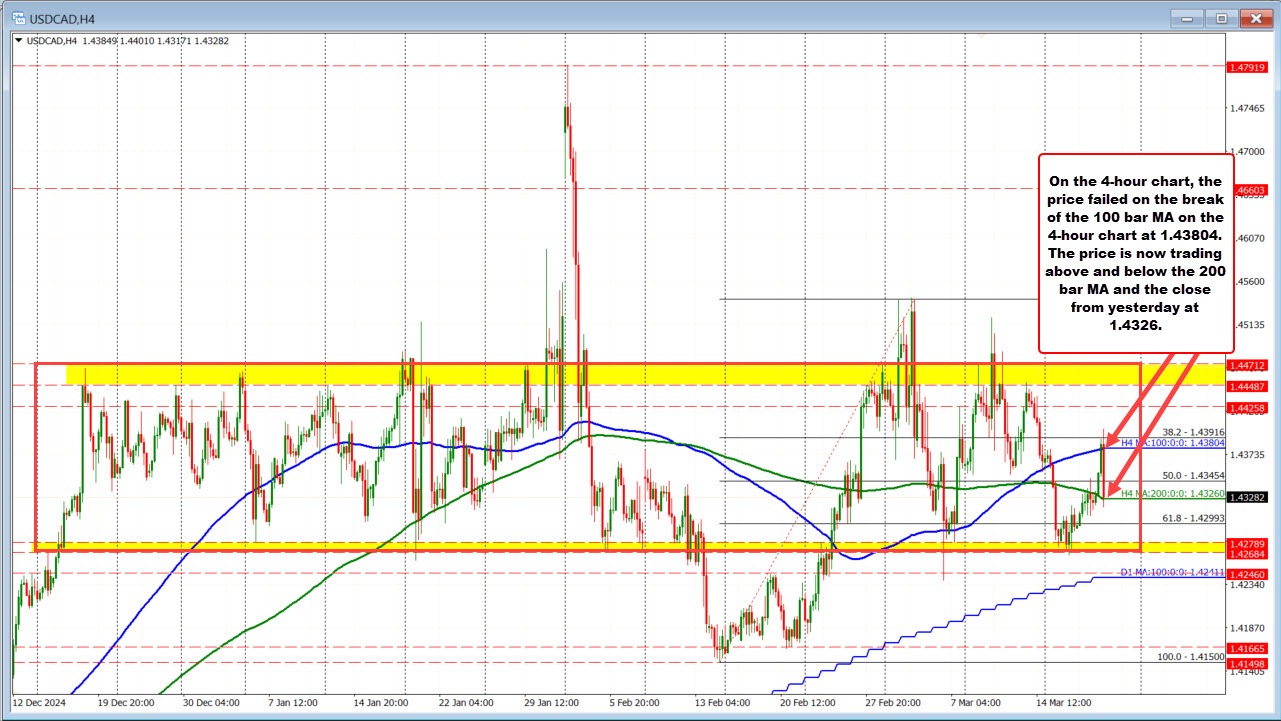
So much for the bullish run higher in the USDCAD with moves above the 200 bar MA on the 4-hour chart, and the 100 bar MA on the same chart (at 1.43804 - see earlier post). The high price reached 1.4401, and buyers made a play, but could not sustain that momentum.
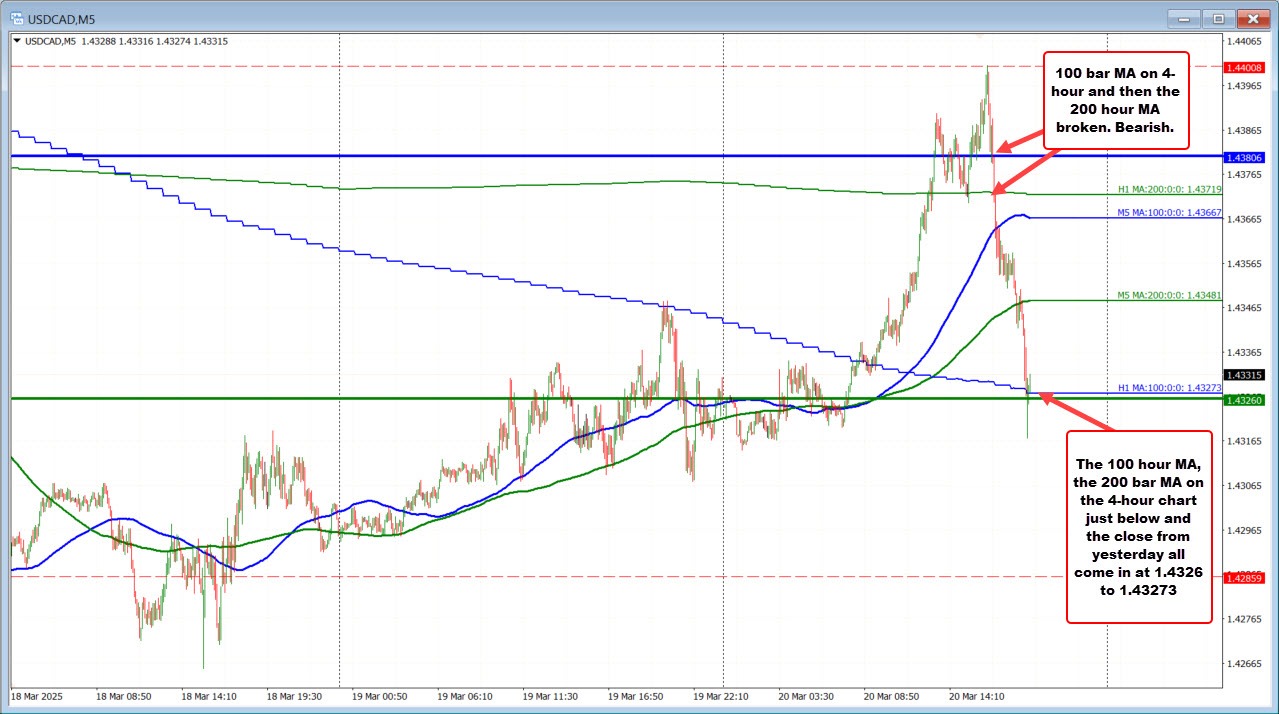
Looking at the 5-minute chart below, the fall back below the 100 bar MA on the 4-hour chart at 1.4380, the 200 hour MA at 1.4372, turned buyers to sellers.
The price has now retraced all the gains on the day and has also moved below the 100 hour MA at 1.4327, the 200 bar MA on the 4-hour at 1.4326, and the close level from yesterday also at 1.4326.
The lap up and back down is now complete.
What now?
The price decline seems to be slowing. The 50% of the move up from the February low is at 1.43454. If the price can move above that, the selling pressure may be over.
Conversely, move below 1.4326 with more momentum, and sellers are back in more control.
Part of the USDCAD is the volatility. Blame can be on the Trump and the tariff news. That remains a risk moving toward April 2. Technicals help, but be aware, that the volatility - up and down - may continue because of the fundamental backdrop.
 Copy Link
 Share on Facebook
 Share on X
 Share by Email
