Gold Technical Analysis – We broke below some key levels. What’s next?
Fundamental Overview
Gold continues to correct lower amid the selloff in the US stock market as it tightens financial conditions when it’s this aggressive.
The problem here is that we got weaker economic data with increasing inflation expectations. The market might be fearing that in case we get a slowdown, the Fed might not be fast enough in cutting rates amid inflation remaining above target and uncomfortably high long-term inflation expectations.
This is the growth scare risk that was highlighted for some downside in gold given the overstretched long positions. The next NFP and CPI reports will be key for the market. Hot data, especially on the inflation side, will likely trigger a strong selloff in gold.
Gold Technical Analysis – Daily Timeframe
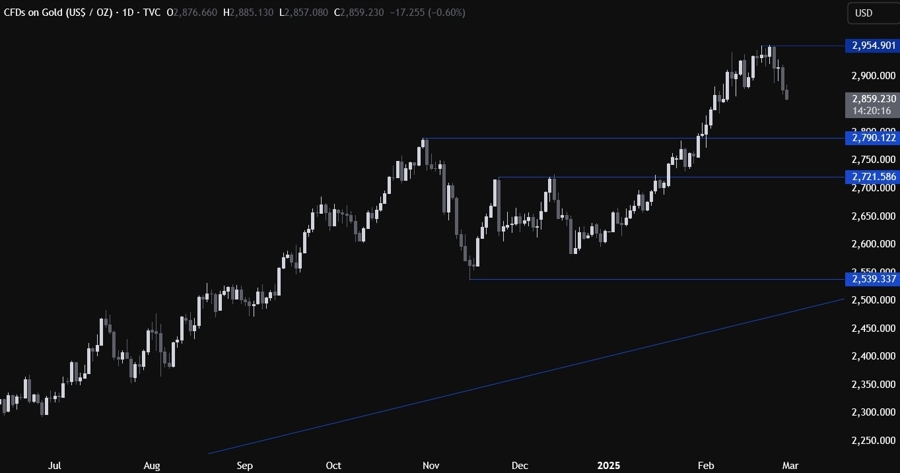
On the daily chart, we can see that gold pulled continues to pull back from the all-time highs amid the selloff in the US stock markets. From a risk management perspective, the buyers will have a better risk to reward setup around the 2790 level, while the sellers will look for a break below the level to start targeting the 2600 level next.
Gold Technical Analysis – 4 hour Timeframe

On the 4 hour chart, we can see that the price broke below the major upward trendline and extended the drop as the sellers piled in with more conviction. We now have a downward trendline defining the bearish momentum.
If we get a pullback into it, we can expect the sellers to lean on the trendline with a defined risk above it to position for the drop into the 2790 level. The buyers, on the other hand, will want to see the price breaking higher to regain some conviction and pile in for a rally into new highs.
Gold Technical Analysis – 1 hour Timeframe

On the 1 hour chart, we can see that we have another minor downward trendline defining the bearish momentum on this timeframe. On an intraday basis, the sellers will likely lean on it to keep pushing into new lows, while the buyers will look for a break higher to target the next trendline and a break above it. The red lines define the average daily range for today
Upcoming Catalysts
Today we conclude the week with the US PCE data.
 Copy Link
 Share on Facebook
 Share on X
 Share by Email