
Nasdaq decline today rivals the big moves lower in 2024
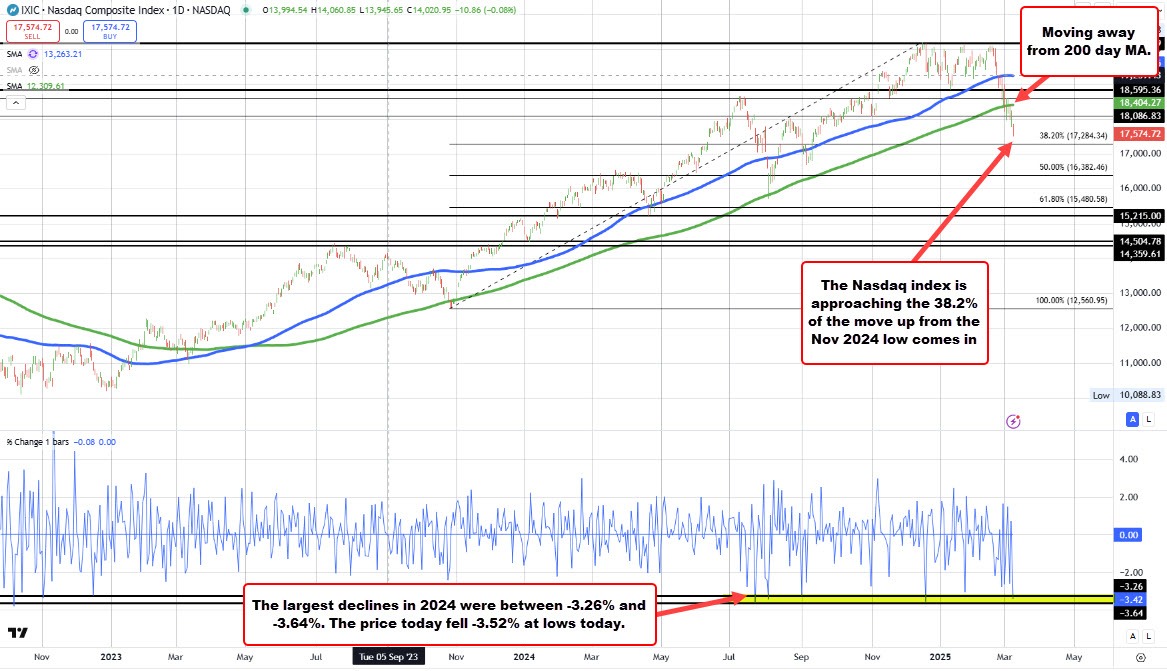
The Nasdaq Composite Index is experiencing continued downside pressure, moving further away from its 200-day moving average (MA) at 18,404. The index is now approaching the 38.2% Fibonacci retracement level of the rally from the November 2024 low, which comes in around 17,284. This level will be a key technical test for buyers looking to defend support.
At today's low, the index fell 3.52%, nearing the largest daily declines of 2024, which ranged between -3.26% and -3.64%. Will the declines start to slow? So far, there is not a lot of bounce.
If selling pressure persists and the 38.2% retracement level fails to hold, it opens the door for increased selling momentum. The next major downside target would be the 50% retracement at 16,382. The last time the index traded at that level was back in August 2024
For upside recovery, the index would ultimately need to regain the 200-day MA at 18,404 to shift momentum back in favor of buyers. However, a closer resistance would be between 17832.70 to 18086.83 area (see yellow area on the 4-hour chart below. Getting above that area would give the buyers some comfort with work to do toward the 200 day MA. Absent that, and the sellers are in control.

 Copy Link
 Share on Facebook
 Share on X
 Share by Email
