
Gold sticks to positive bias amid dovish Fed-inspired USD weakness; US PCE data awaited
- Gold extends its sideways consolidative price move and remains confined in the weekly range.
- Dovish Fed expectations continue to undermine the USD and lend support to the commodity.
- Bulls, however, might opt to wait for the US PCE Price Index before placing aggressive bets.
Gold (XAU/USD) builds on its steady intraday ascent through the early European session on Friday, though it remains within a broader trading range held since the beginning of this week. The US Dollar (USD) attracts fresh sellers and slides back closer to its lowest level since late October, touched on Thursday, amid dovish Federal Reserve (Fed) expectations. This, in turn, is seen as a key factor driving flows towards the non-yielding yellow metal.
Apart from this, the cautious market mood and geopolitical uncertainties stemming from the protracted Russia-Ukraine war lend additional support ot the safe-haven Gold. The XAU/USD bulls, however, might refrain from placing aggressive bets and opt to wait for the release of the September Personal Consumption Expenditures (PCE) Price Index. The data would offer cues about the Fed's rate-cut path and provide a fresh impetus to the commodity.
Daily Digest Market Movers: Gold benefits from dovish Fed expectations, cautious market mood
- Global outplacement firm Challenger, Gray & Christmas said that planned job cuts declined 53%, to 71,321 in November, from 153,074 in the previous month, which was the highest for an October month since 2003. Separately, the US Labour Department reported that Initial Jobless Claims fell to 191K in the week ended November 29, marking the lowest level in more than three years.
- Despite the upbeat labor market reports, traders are still pricing in an over 85% probability that the US Federal Reserve will cut interest rates by 25 basis points at its upcoming policy meeting next week. This, in turn, fails to assist the US Dollar to build on Thursday's modest recovery move and continues to act as a tailwind for the non-yielding Gold through the Asian session on Friday.
- Russian President Vladimir Putin said on Thursday that some proposals in a US plan to end the war in Ukraine are unacceptable, suggesting that any deal is still some ways off. Furthermore, Putin warned again that Ukrainian troops must withdraw from the Donbas region or Russia will seize it. This keeps geopolitical risks in play and turns out to be another factor supporting the commodity.
- Market participants are now eyeing the September US Personal Consumption Expenditures (PCE) Price Index. The headline print is expected to show that annual inflation in the US edged higher to 2.8% from 2.7% in August. Meanwhile, the core PCE Price Index – which is seen as the Fed's preferred inflation gauge – is seen holding steady at the 2.9% YoY rate during the reported month.
- Nevertheless, the crucial data will be scrutinized closely for more cues about the Fed's future rate-cut path. This will drive the USD demand and provide a fresh directional impetus to the commodity. In the meantime, the mixed fundamental backdrop, warrants caution before placing aggressive bets around the XAU/USD pair, which seems poised to post modest weekly losses.
Gold bulls need to wait for acceptance above $4,245-4,250 before placing fresh bets
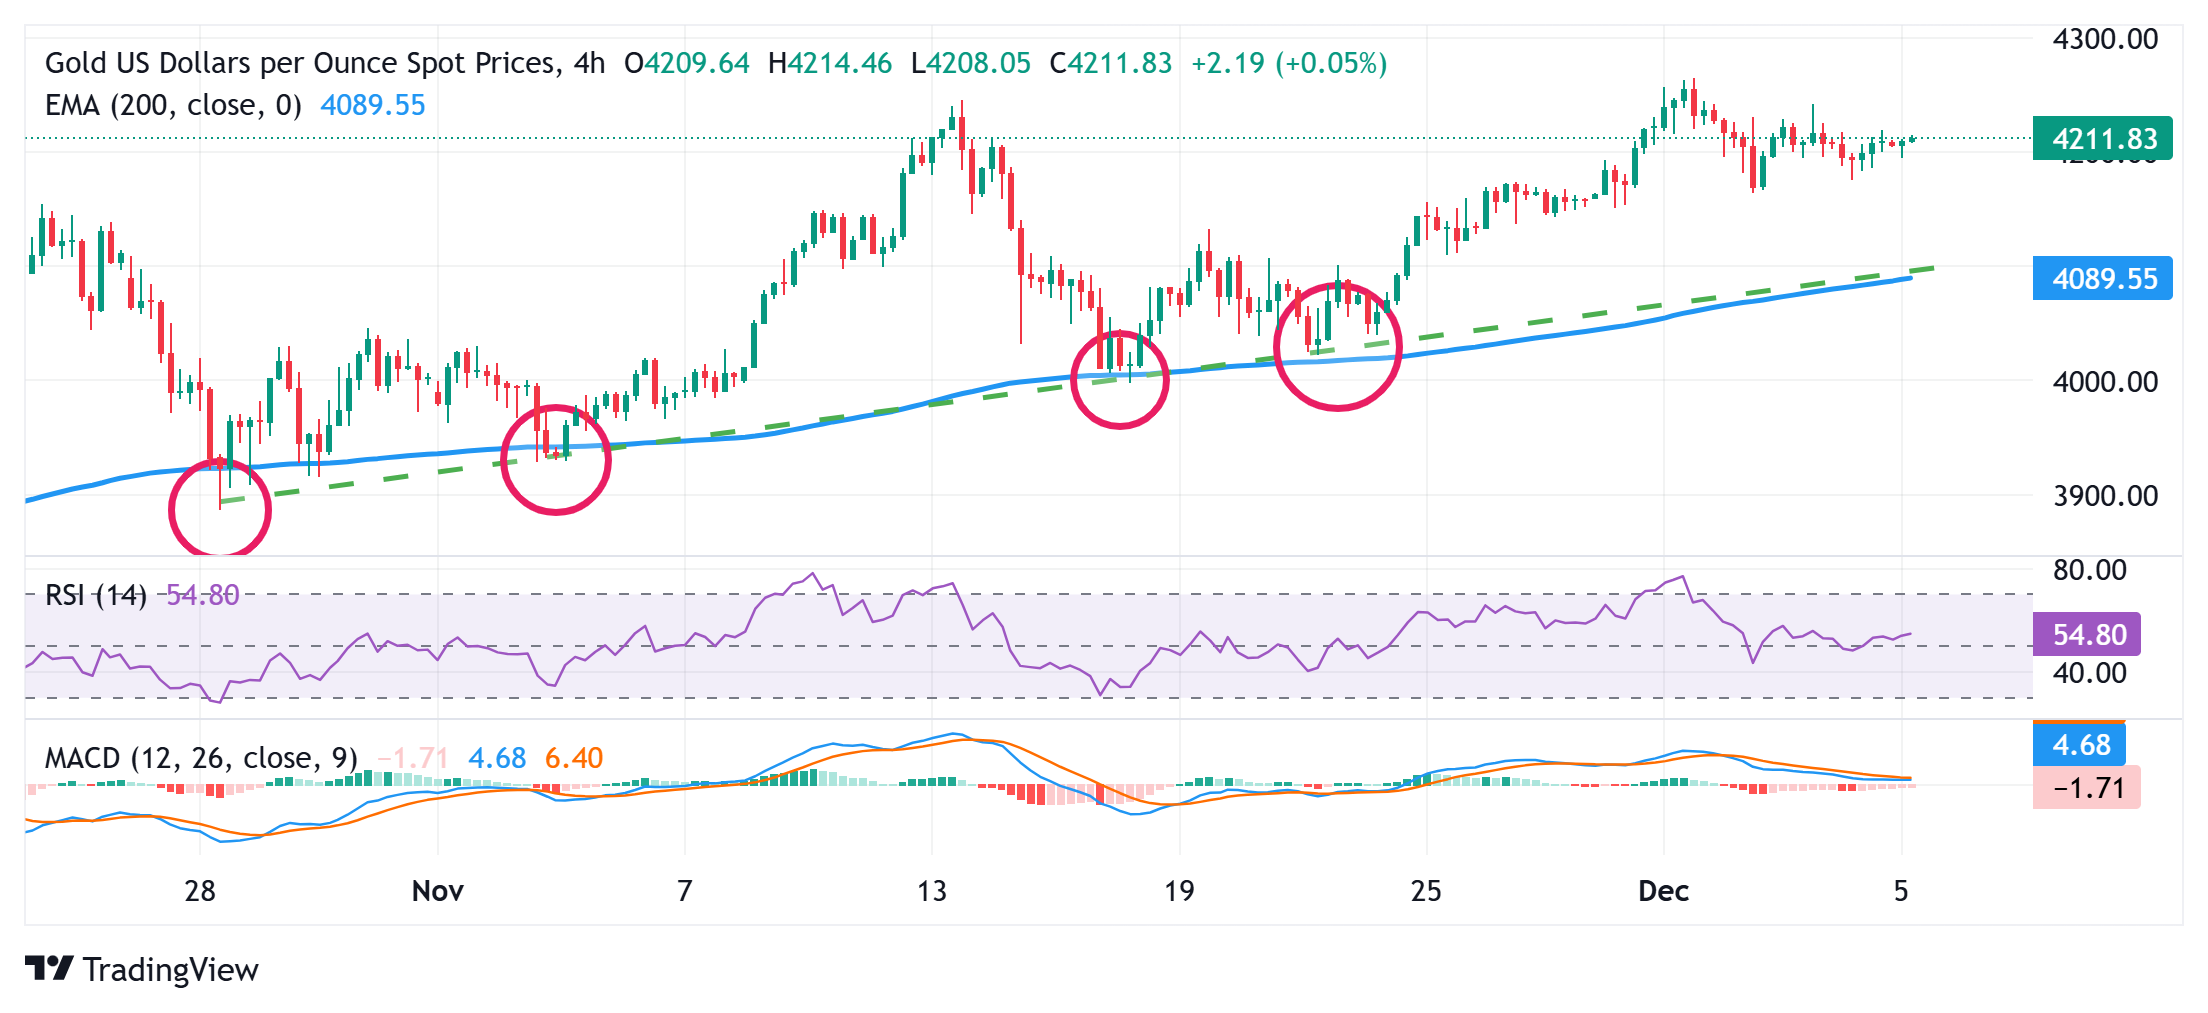
Any upside momentum might continue to face some resistance near the $4,245-4,250 region amid mixed technical oscillators on hourly/daily charts. The next relevant hurdle is pegged near the $4,277-4,278 area, above which the Gold price could aim to reclaim the $4,300 round figure. A sustained strength beyond the latter will be seen as a key trigger for the XAU/USD bulls and pave the way for additional near-term gains.
On the flip side, dips towards the weekly low, around the $4,164-4,163 region, might still be seen as a buying opportunity and remain limited. A convincing break below, however, might prompt technical selling and make the Gold price vulnerable to test the $4,100-4,090 confluence. The latter comprises the 200-period Exponential Moving Average (EMA) on the 4-hour chart and an ascending trend-line extending from late October, which in turn, should act as a strong base for the XAU/USD pair.
US Dollar Price This week
The table below shows the percentage change of US Dollar (USD) against listed major currencies this week. US Dollar was the strongest against the Swiss Franc.
| USD | EUR | GBP | JPY | CAD | AUD | NZD | CHF | |
|---|---|---|---|---|---|---|---|---|
| USD | -0.60% | -0.88% | -1.05% | -0.25% | -1.23% | -0.82% | -0.15% | |
| EUR | 0.60% | -0.29% | -0.45% | 0.36% | -0.64% | -0.25% | 0.45% | |
| GBP | 0.88% | 0.29% | 0.08% | 0.64% | -0.35% | 0.04% | 0.74% | |
| JPY | 1.05% | 0.45% | -0.08% | 0.80% | -0.20% | 0.22% | 0.89% | |
| CAD | 0.25% | -0.36% | -0.64% | -0.80% | -1.03% | -0.58% | 0.10% | |
| AUD | 1.23% | 0.64% | 0.35% | 0.20% | 1.03% | 0.41% | 1.09% | |
| NZD | 0.82% | 0.25% | -0.04% | -0.22% | 0.58% | -0.41% | 0.68% | |
| CHF | 0.15% | -0.45% | -0.74% | -0.89% | -0.10% | -1.09% | -0.68% |
The heat map shows percentage changes of major currencies against each other. The base currency is picked from the left column, while the quote currency is picked from the top row. For example, if you pick the US Dollar from the left column and move along the horizontal line to the Japanese Yen, the percentage change displayed in the box will represent USD (base)/JPY (quote).
 Copy Link
 Share on Facebook
 Share on X
 Share by Email
