
Crude Oil Technical Analysis – Growth concerns remain in the spotlight
Fundamental Overview
Crude oil has been under some strong pressure lately as a mix of negative supply and demand drivers weighed on the market.
In fact, on the supply side, OPEC+ recently surprised announcing plans to increase production starting in April. The timing of the move wasn’t good as the markets recently started to worry about the demand side as growth fears grew amid weaker US data and a selloff in the US stock markets.
The focus now switches to the FOMC decision on Wednesday. The market is currently priced for roughly three rate cuts by the end of the year following some weak US data in the past weeks.
If the Fed revises the expected cuts from two to three in 2025, we might get some relief rally in risk assets and crude oil. Conversely, if the Fed remains resolute on the two rate cuts, we might see some weakness in the risk sentiment (all else being equal).
Crude Oil Technical Analysis – Daily Timeframe
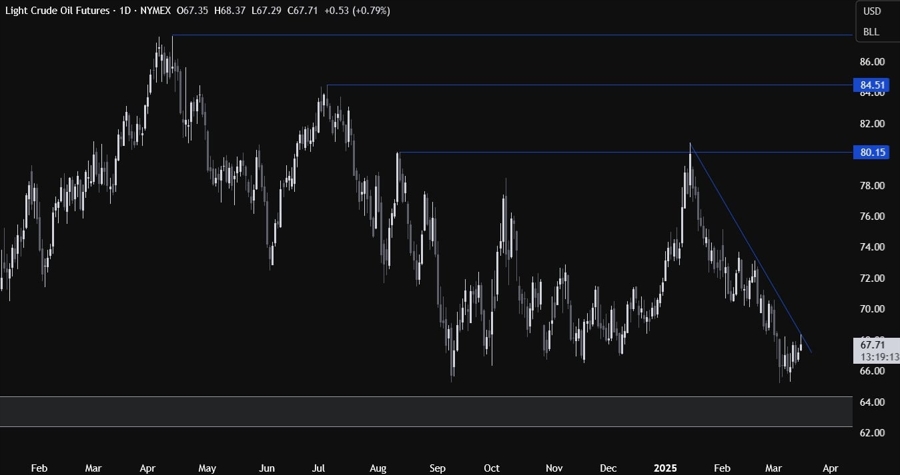
On the daily chart, we can see that crude oil is testing the trendline around the 68.00 handle. This is where we can expect the sellers to step in with a defined risk above the trendline to position for a drop into the key 63 support zone targeting a break below it. The buyers, on the other hand, will want to see the price breaking above the trendline to pile in for a rally back into the 80.00 handle.
Crude Oil Technical Analysis – 4 hour Timeframe
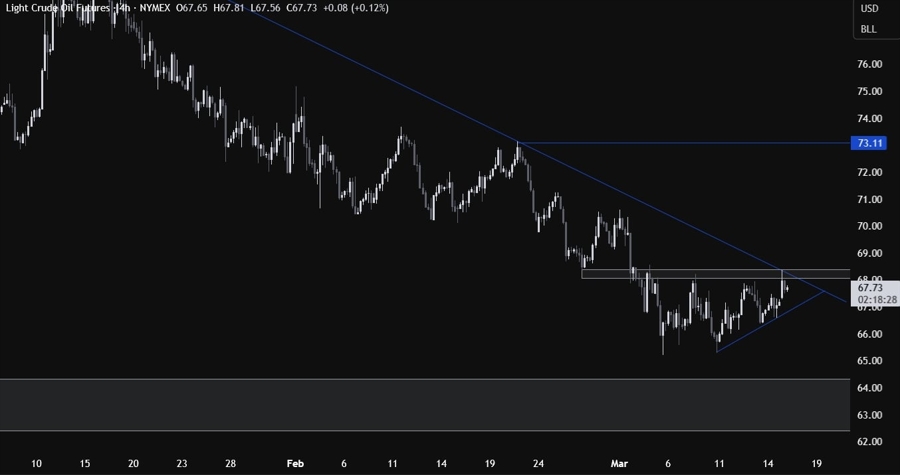
On the 4 hour chart, we can see that we have a strong resistance zone around the 68.00 handle where we have the confluence with the trendline. The sellers will look for a rejection here to keep pushing into new lows, while the buyers will look for a break higher to regain some control. A break below the counter-trendline should see the bearish momentum picking up as the sellers will likely increase the bearish bets into new lows.
Crude Oil Technical Analysis – 1 hour Timeframe

On the 1 hour chart, we can see more clearly the bearish setup around the 68.00 resistance zone. If we get a pullback into the counter-trendline around the 67.00 handle, we can expect the buyers to lean on the trendline to position for the break above the resistance with a better risk to reward setup. The sellers, on the other hand, will look for a break lower to increase the bearish bets into the 63.00 support zone. The red lines define the average daily range for today.
Upcoming Catalysts
Today we get the US Retail Sales data. On Wednesday, we have the FOMC Policy Decision. On Thursday, we get the US Jobless Claims figures.
 Copy Link
 Share on Facebook
 Share on X
 Share by Email
