
USDCAD Technical Analysis – We are trading at a key resistance
Fundamental Overview
The USD has been relatively stronger against most major currencies since Friday as the markets went into risk-off following some bad US data release. In fact, we got a weak US Flash Services PMI and soon after the long-term inflation expectations in the Final UMich Consumer Sentiment survey jumped to a new 30-year high.
The risk-off sentiment picked up after the jump in the long-term inflation expectations. The market might be fearing that in case we get a slowdown, the Fed might not be fast enough in cutting rates amid inflation remaining above target and uncomfortably high long-term inflation expectations.
This is something to keep in mind in light of the next NFP and CPI reports coming out before the March FOMC decision where we will also get the updated SEP and Dot Plot.
On the CAD side, the economic data out of Canada has been showing gradual improvement and the central bank is now past the peak in dovishness which should further support the CAD. The risk-off sentiment though and the renewed threat of tariffs isn’t helping the Loonie.
USDCAD Technical Analysis – Daily Timeframe

On the daily chart, we can see that USDCAD pulled back into the key resistance around the 1.4280 level. This is where we can expect the sellers to step in with a defined risk above the resistance to position for a drop into the 1.40 handle. The buyers, on the other hand, will want to see the price breaking higher to target the 1.45 handle next.
USDCAD Technical Analysis – 4 hour Timeframe

On the 4 hour chart, there’s not much else we can add here as the sellers will look for a rejection, while the buyers will look for a break. We need to zoom in to see some more details.
USDCAD Technical Analysis – 1 hour Timeframe
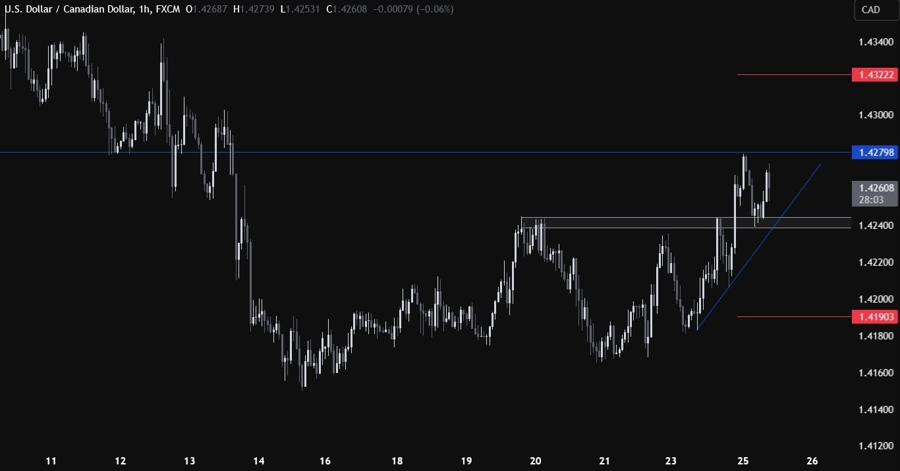
On the 1 hour chart, we can see that we have a minor upward trendline defining the current pullback and we also have a strong minor support around the 1.4240 level. If we get a pullback into the trendline, we can expect the buyers to lean on it to position for the break above the resistance. The sellers, on the other hand, will look for a break below the trendline and the support to increase the bearish bets into new lows. The red lines define the average daily range for today.
Upcoming Catalysts
Today we have the US Consumer Confidence report. On Thursday, we get the latest US Jobless Claims figures, while on Friday we conclude the week with the Canadian GDP and the US PCE data.
 Copy Link
 Share on Facebook
 Share on X
 Share by Email
