
GBPUSD Technical Analysis: Focus on key UK and US data this week for the next direction
KEY POINTS:
- GBPUSD keeps the bullish trend going as it bounces from a major trendline
- The BoE set to cut the Bank Rate by 25 bps on Thursday
- The Fed delivered on expectations, but Powell sounded more dovish
- US NFP and CPI in focus
FUNDAMENTAL OVERVIEW
USD:
The USD has been weakening across the board since last week’s FOMC decision. The Fed delivered on expectations cutting by 25 bps and signalling a higher bar for further rate cuts, but Fed Chair Powell’s press conference was seen as fairly dovish.
In fact, instead of sounding as neutral as possible and stressing data-dependency, he downplayed the inflation risk and emphasized the labour market weakness, suggesting that there’s more tolerance for higher inflation than for weaker labour market.
The focus this week will be on the US NFP and CPI reports that will wrap up the last real trading week of the year before market participants prepare for the holidays. Right now, the market is pricing 57 bps of easing by the end of 2026.
If we get strong US data, especially on the labour market side, we will likely see a hawkish repricing which would give the US dollar a boost. On the other hand, weak data should weigh on the greenback further as the market will bring rate cut bets forward.
GBP:
On the GBP side, the recent data validated the expectations for a rate cut at the upcoming BoE meeting. We got a weak UK GDP last week, and before that, a soft UK labour market report and benign CPI data.
The market is pricing a 91% chance of a rate cut on Thursday, so the focus will be mainly on their forward guidance. Traders are also seeing 64 bps of total easing by the end of 2026, and that will be shaped by the economic data in the next months.
GBPUSD TECHNICAL ANALYSIS – DAILY TIMEFRAME
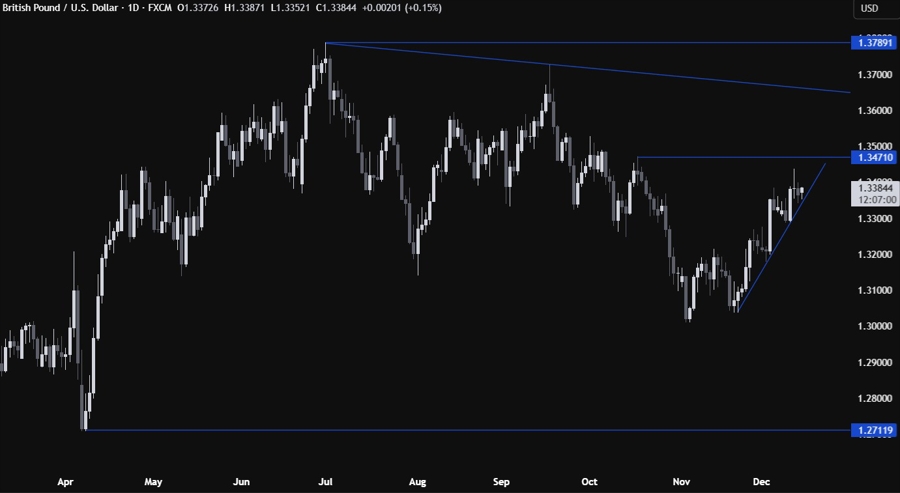
On the daily chart, we can see that we have a major upward trendline defining the bullish momentum. The buyers continue to lean on the trendline with a defined risk below it to keep pushing into new highs. The sellers, on the other hand, will want to see the price breaking below the trendline to pile in for a drop into the 1.3200 handle next.
GBPUSD TECHNICAL ANALYSIS – 4 HOUR TIMEFRAME
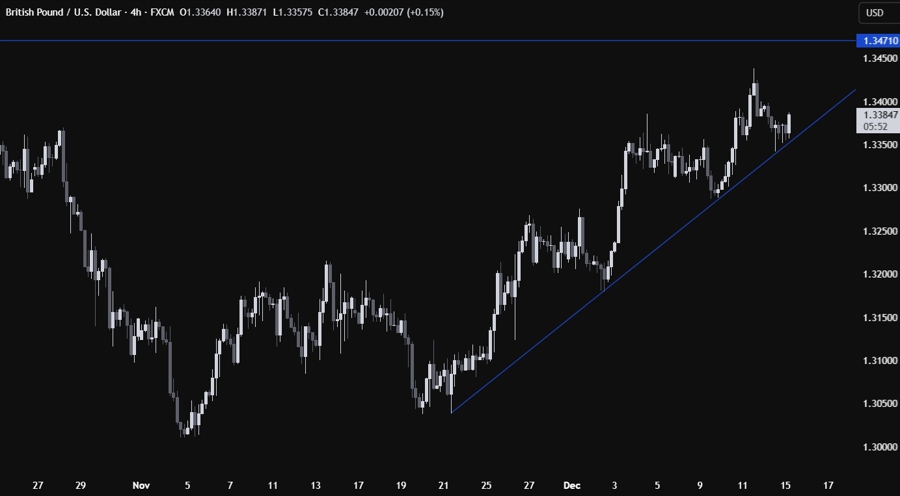
On the 4 hour chart, we can see more clearly how the major trendline has been acting as a reliable support for the buyers. The natural target should be the key daily swing level at 1.3470. If the price gets there, we can expect the sellers to step in with a defined risk above the level to position for a drop back into the trendline targeting a breakout. The buyers, on the other hand, will look for a break higher to increase the bullish bets into new highs.
GBPUSD TECHNICAL ANALYSIS – 1 HOUR TIMEFRAME
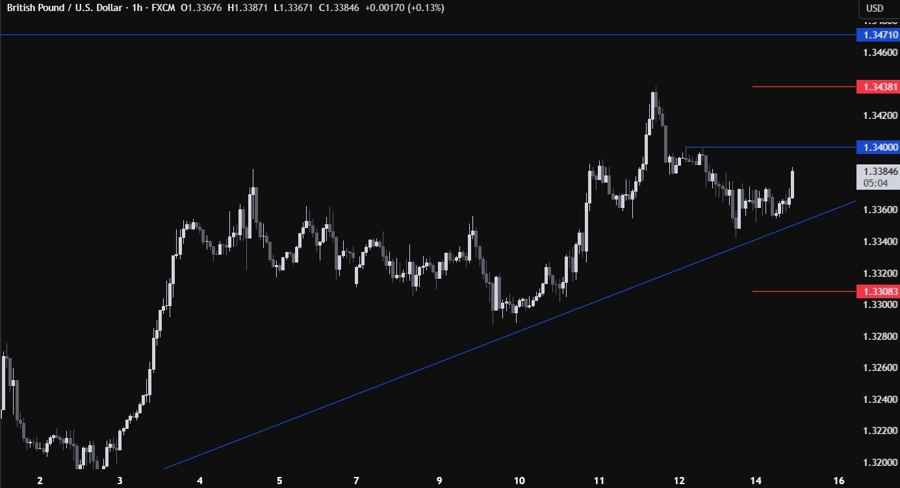
On the 1 hour chart, we can see that we have a key swing level around the 1.34 handle. That’s where we can expect the sellers to step in with a defined risk above the level to position for a drop back into the trendline targeting a breakout. The buyers, on the other hand, will look for a break higher to extend the rally into the 1.3470 level next. The red lines define the average daily range for today.
UPCOMING CATALYSTS
Tomorrow we have the UK employment report and the US NFP. On Wednesday, we have the UK CPI report. On Thursday, we have the BoE rate decision and the US CPI data. On Friday, we conclude the week with the UK Retail Sales data.
 Copy Link
 Share on Facebook
 Share on X
 Share by Email
