
Why Bitcoin Is Falling? BTC Drops to $104,000 and Could Crash 30% Lower According to This New Bitcoin Price Prediction
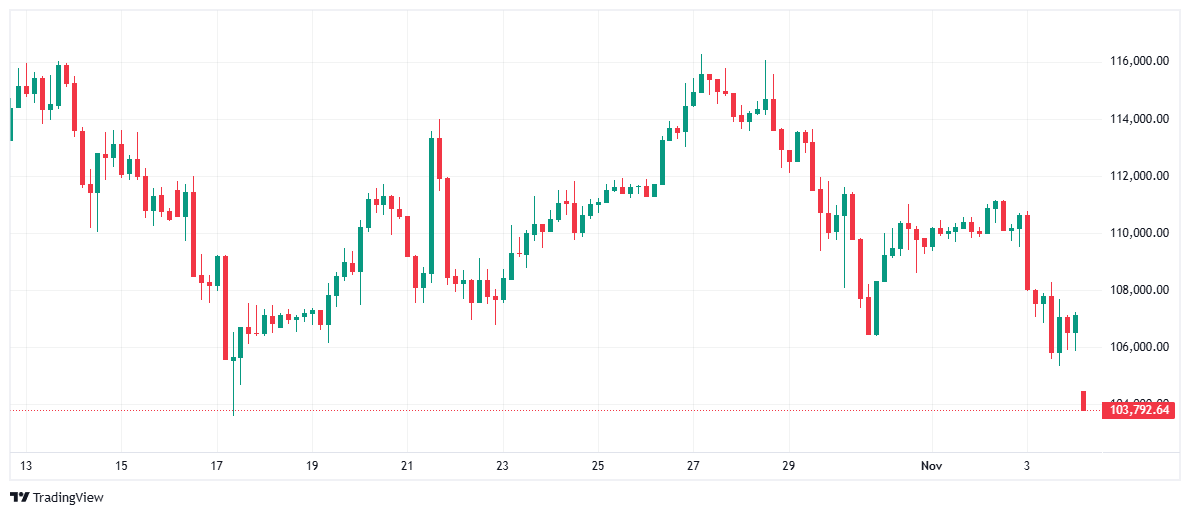
Bitcoin (BTC) price is falling very dynamically for the second consecutive session, losing a total of over 5% and violating the important support zone marked by July and August minimums.
Today (Tuesday) November 4 2025, Bitcoin costs $104,288, a lower price than the October 17 crash, and we previously observed such low values at the end of June.
Is this the end of the decline, or does Bitcoin still have room for further depreciation? And if so, why Bitcoin price it going down and how low BTC can go? I explore these questions in this article, drawing on more than ten years of experience as a cryptocurrency analyst and investor. My latest Bitcoin price predictions, however, are rather bearish.
Why Bitcoin Price Is Going Down? Worst October in Decade Ends Rally Streak
Bitcoin began November under pressure after closing out its worst October in ten years. The cryptocurrency fell 3.69% in October, snapping a remarkable seven-year "Uptober" streak and marking only the third time Bitcoin closed October in the red.
On average, October has historically delivered gains of 19.92%, while 2025 recorded a loss of 3.69%, representing a 23.61 percentage point underperformance relative to historical patterns.
The broad-based decline shaved another $100 billion off total crypto market capitalization, now hovering near $3.56 trillion, with Bitcoin falling 2.8% in 24 hours while Ethereum dropped 6% to around $3,630, Solana led losses with a 10% slide to below $160 (extending its seven-day drop to more than 20%), BNB lost 6.4%, and XRP shed 5%.
Bitcoin Decline Metrics | November 4, 2025 |
Current Price | $104,287.93 |
Daily Change | -$2,270.05 (-2.13%) |
Intraday Low | $104,139.52 |
Session Range | $104,139.52-$107,269.85 |
October Performance | -3.69% (worst in decade) |
From ATH Decline | -17.4% |
Market Cap | $2.06 trillion |
Technical Breakdown Below 200-Day Moving Average
According to my technical analysis, Bitcoin has fallen below the support grid marked by the 38.2% Fibonacci retracement, the 200-day exponential moving average (200 EMA), and horizontal levels. The terrain officially changes to bearish. With the 200 EMA breakdown, Bitcoin has an open road to retesting the psychological $100,000 level—representing June lows which combine with the 50% Fibonacci retracement.
If this level doesn't hold and Bitcoin fails its ultimate test, I would expect further and stronger Bitcoin depreciation. How low can the cryptocurrency fall, however? At this moment, I would point to three potential levels or target ranges.
How Low Can Bitcoin Go? BTC Price Prediction Targets $94K, Then $77K, Ultimately $74K
My first target is the area of the 61.8% Fibonacci retracement combined with the 100% Fibonacci extension, stretching from $92,000 to $94,000, which coincides with lows from late April and early May. The ultimate range of declines, however, is this year's April lows in the area of the $74,000-$77,000 zone, where Fibonacci extensions again align with us, and at this moment the 161.8% level.
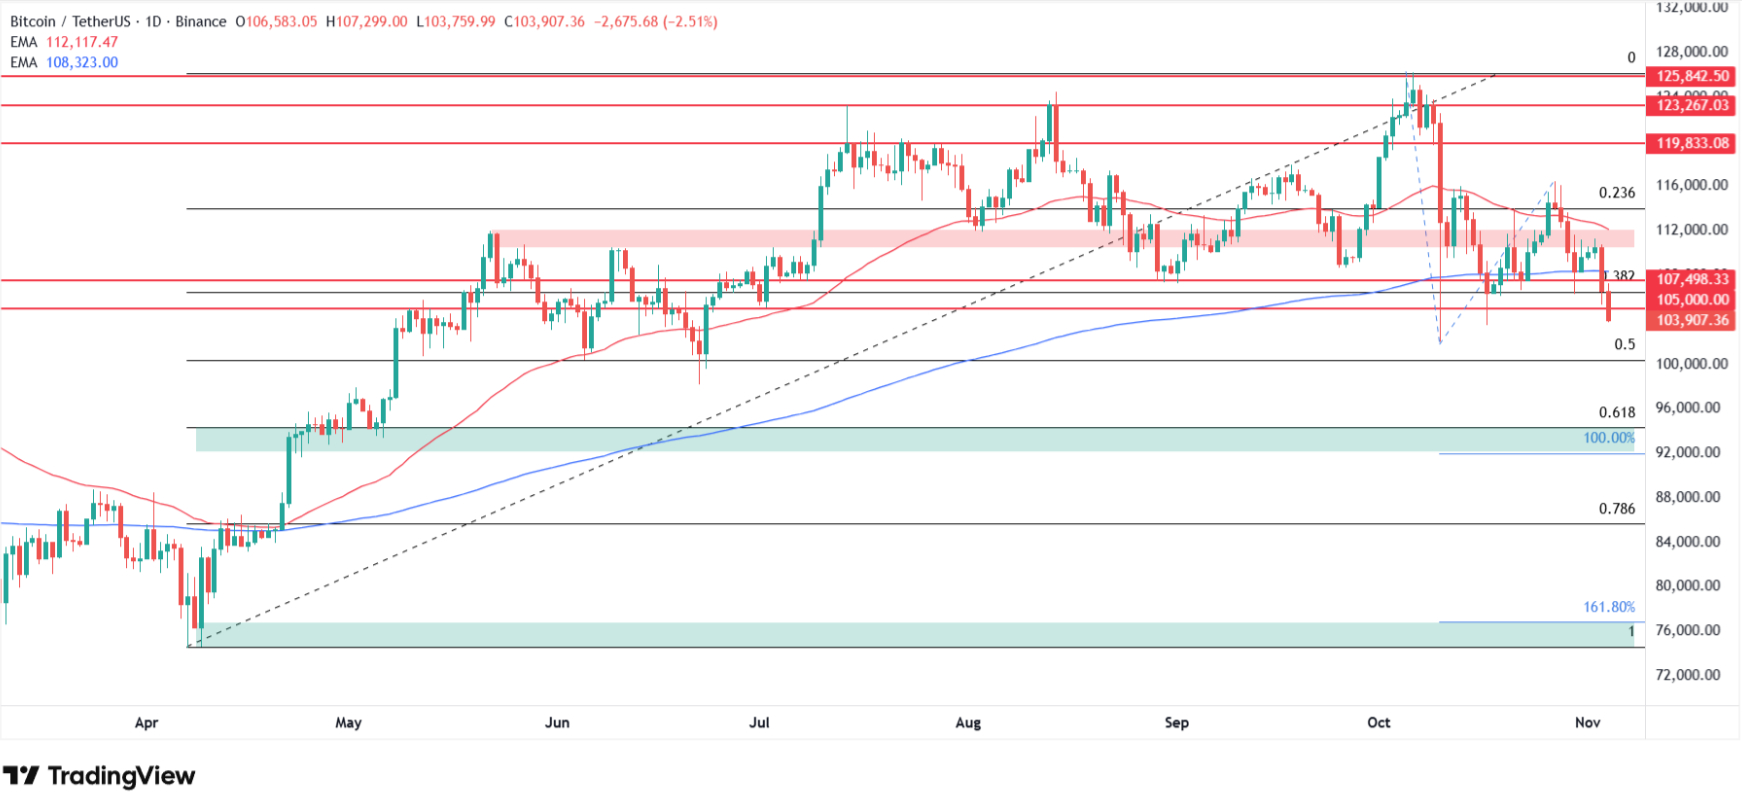
This would mean that Bitcoin, according to my forecasts, could slide from current levels by almost 30% and erase the entire upward rally observed over the last six months when it gained a total of 70%.
Bitcoin Downside Targets | Level | Decline from Current | Technical Significance |
Current Price | $104,288 | — | Breaking 200-day MA |
Immediate Test | $100,000 | -4.1% | Psychological + 50% Fibonacci + June lows |
First Target | $92,000-$94,000 | -11.8% to -9.9% | 61.8% Fib + 100% Extension (Apr-May lows) |
Second Target | $77,000 | -26.2% | April 2025 lows + 161.8% Extension |
Ultimate Target | $74,000 | -29.0% | April lows + Complete rally erasure |
Lacie Zhang, Research Analyst at Bitget Wallet, provided a more moderate outlook: "Market data and technical signals suggest Bitcoin may trade within a $94,000–$118,000 range in the near term. The lower bound represents a healthy retracement zone consistent with subdued ETF inflows, while the upper range reflects a measured recovery below the October high near $125K."
You may also like to check my previous Bitcoin and crypto analyses:
[#highlighted-links#]
But Long-Term Bulls Remain Confident
Despite the bearish near-term technical setup, Joel Kruger, strategist at LMAX, emphasized that the broader uptrend remains intact: "There's been a lot of talk about a bear market, and sentiment has certainly turned fearful. Yet when we take a step back, the broader picture remains far more constructive and upbeat. Despite recent volatility, nothing has changed in the underlying outlook. The current setbacks have done little to compromise what continues to be a powerful uptrend in Bitcoin."
He noted that "Bitcoin has been in a sustained uptrend since 2023. Each pullback since that breakout has found strong support near the 50-week SMA, which also roughly aligns with the top of the Ichimoku cloud. On two occasions since 2023, bitcoin briefly slipped below this level, but in both cases, weekly closes recovered swiftly back above it."
Why Bitcoin Is Falling?
Federal Reserve Uncertainty Dampens Risk Appetite
The Federal Reserve's recent actions and cautious messaging have contributed to broader risk aversion across markets. The Fed delivered a 25-basis-point cut last week as widely expected, but Chair Jerome Powell's restrained tone dampened risk appetite after he hinted that December's cut isn't guaranteed.
This shift in expectations proved dramatic, the market's probability of a cut at December's FOMC meeting stood as high as 96% leading up to last Wednesday's decision, but after Powell's press conference, this dropped drastically to less than 70% chance. The collapse in rate cut expectations created headwinds for risk assets like Bitcoin that benefited from assumptions of continuous monetary easing.
On-Chain Data Suggests Further Weakness Ahead
BeInCrypto's analysis of the Net Unrealized Profit/Loss (NUPL) metric shows how much profit or loss Bitcoin investors are holding. Currently, Bitcoin's NUPL sits at 0.47, the lowest level since April 8 when it fell to 0.42.
During that earlier cycle, Bitcoin's NUPL declined in three stages: 0.48 on February 26, 0.44 on March 10, and 0.42 on April 8, before Bitcoin rallied from $76,000 to above $125,000.
Critical Test at Bitcoin $100,000 Psychological Level
If Bitcoin doesn't hold the psychological $100,000 level and fails its ultimate test, I would expect further and stronger Bitcoin depreciation toward my identified targets. The convergence of the 50% Fibonacci retracement, June 2025 lows, and the major psychological threshold creates a powerful support confluence that will likely attract significant buying interest.
However, a sustained break below $100,000 would open the path to my first target zone at $92,000-$94,000 (61.8% Fibonacci retracement combined with 100% Fibonacci extension), representing late April and early May lows. From there, the ultimate downside targets sit at $74,000-$77,000, this year's April lows where the 161.8% Fibonacci extension falls.
This would mean Bitcoin could slide from current $104,288 levels by almost 30%, erasing the entire upward rally observed over the last six months when it gained a total of 70%.
While this represents a severe correction, it would align with historical Bitcoin drawdown patterns during consolidation phases within longer-term bull markets.
Bitcoin Price Analysis, FAQ
Why is Bitcoin falling today?
Bitcoin dropped 2.13% to $104,288 Tuesday extending second consecutive session decline totaling over 5%, breaking below critical 200-day moving average $109,840 (now -5.1% below fragile support), after worst October in decade (-3.69% ending seven-year "Uptober" streak), triggered by Federal Reserve Powell walking back December rate cut expectations (probability collapsed 96% to below 70%), $100 billion crypto market cap loss, broader altcoin crash (Ethereum -6%, Solana -10%, XRP -5%), NUPL metric at 0.47 (lowest since April suggesting further weakness).
How low can Bitcoin price go?
According to my technical analysis, Bitcoin could decline 30% from current $104,288 to ultimate target $74,000-$77,000 (April 2025 lows + 161.8% Fibonacci extension erasing entire six-month 70% rally), staged breakdown: immediate test $100,000 psychological level (-4.1% combining 50% Fib + June lows), first target $92,000-$94,000 (-11.8% to -9.9% representing 61.8% Fib + 100% extension).
Will Bitcoin drop below $100,000?
Yes, it is possible. Bitfinex analysts warn "sustained break below $106,000-$107,000 range could send BTC back under $100,000," while my analysis shows breaking $100,000 (50% Fibonacci + June lows) opens path to $92,000-$94,000, though Kruger emphasizes "$103,000 50-week SMA leaving bitcoin still firmly in uptrend despite softness, additional weakness should be viewed as corrective not structural," with NUPL at 0.47 suggesting possible decline toward 0.42-0.44 by early-mid December before accumulation phase.
Is Bitcoin a sell now?
Yes. Trading below both 50-day EMA $113,549 (-8.9% overhead resistance) and 200-day EMA $109,840 (broken -5.1% bearish), my analysis forecasting potential 30% decline to $74,000-$77,000, volume 55.5% of average indicating distribution.
 Copy Link
 Share on Facebook
 Share on X
 Share by Email
