
This New Silver Price Prediction Suggests Precious Metal Can Double to $100 Following Gold Price Rally
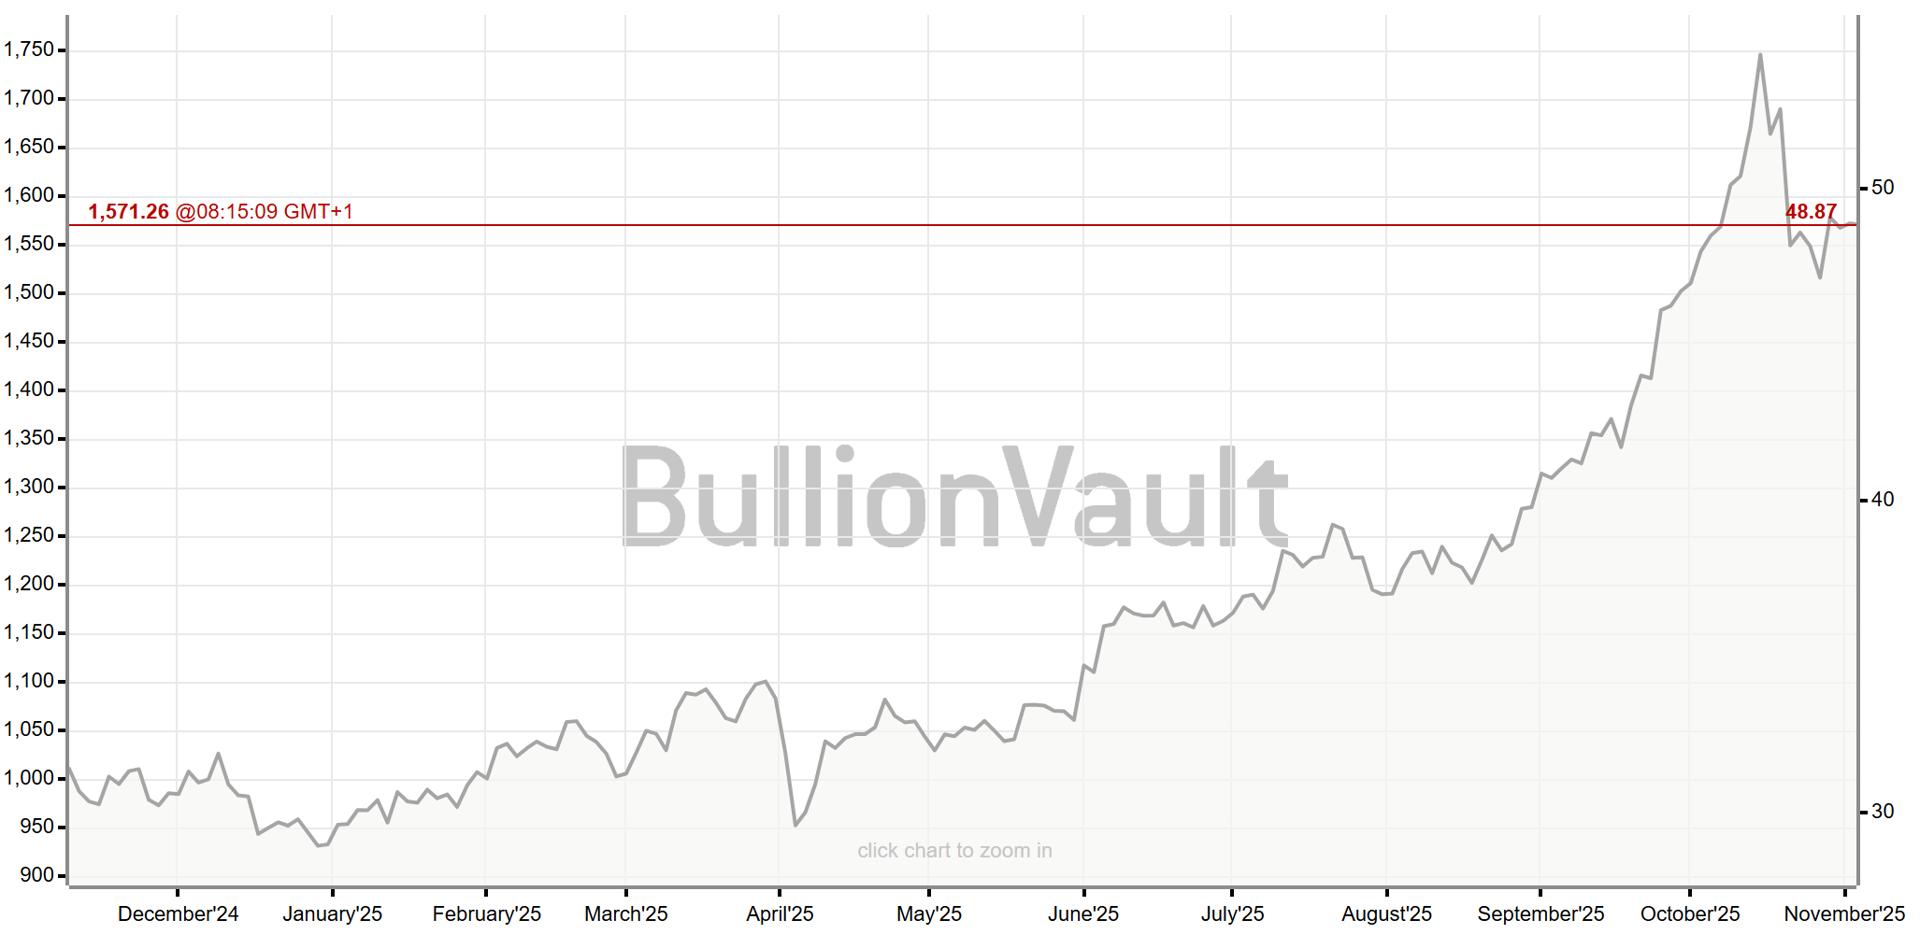
Silver prices rebounded today (Monday), 3 November 2025, to $48.66 per ounce (+1.03%), consolidating near record highs as analysts increasingly predict the white metal could double toward $100 once it decisively breaks through the psychologically critical $50 barrier.
My technical analysis of XAG/USD, based on more than a decade of experience as a trader and analyst, also confirms the potential for strong gains. In this article, I examine why silver is increasing and how high the silver price could go.
Why Silver Price Is Going Up Today?
After a modest correction from historical highs tested in October, prices are rebounding from the 50-day exponential moving average (50 EMA) and moving in consolidation still close to record prices.
Silver Price Metrics | November 3, 2025 |
Current Price | $48.66/oz |
Daily Change | +$0.495 (+1.03%) |
Session Range | $47.80-$48.72 |
Year High (Oct 2025) | $53.34 |
Year Low | $28.31 |
YTD Gain | +71.9% |
Silver's rebound coincides with rising market turbulence as investors trimmed exposure to risk assets. The Federal Reserve delivered a quarter-point rate cut as expected, but Chair Jerome Powell's remarks about data dependency limited expectations for additional easing in December.
"Although the central bank delivered a quarter-point rate cut, Chair Jerome Powell's remarks about data dependency limited expectations for additional easing in December," according to Jainam Mehta from Traders Union.
The Trump-Xi summit brought modest progress on trade but failed to deliver major breakthroughs.
The record high price of gold, which I wrote about last week, also plays a role in this. Silver prices usually move in tandem with the yellow metal.
At this moment, the most significant area will be resistance around $54, and breaking through it will open the path to price discovery.
How High Can Silver Go? Analysts See Silver Doubling to $100 After $50 Breakout
Several analysts believe silver could surge dramatically once it crosses and holds above the $50 psychological threshold. According to a CNBC analysis published October 13, silver could double to $100 per ounce after successfully breaching the $50 mark, a level that has proven to be major resistance since the 2011 peak of $49.45 (which was briefly exceeded in October 2025 when silver hit $53.34).
The $100 target represents more than a 100% gain from current $48.66 levels, but it aligns with historical patterns where silver experiences explosive rallies once key resistance levels are broken. The white metal's behavior often follows gold with amplified volatility, and with gold trading above $4,000 for the first time earlier this year, the spillover effect into silver could be substantial.
Silver to hit $100 by the end of 2026 says BNP Paribas and Solomon Global 🚨🚨 pic.twitter.com/wshWWjE9LU
— Barchart (@Barchart) October 14, 2025
"Despite recent gains, silver is still cheap compared to gold. Lower U.S. yields, limited availability of physical metal, and robust industrial and investor demand are propelling prices into new territory. With this persistent imbalance between supply and demand, a $100 silver price by the end of 2026 is certainly within reach," Solomon Global analysts predict.
Robert Kiyosaki’s Silver Price Prediction: Whie Metal Heading to $75 Next
"Rich Dad Poor Dad" author Robert Kiyosaki, known for his bullish precious metals stance, posted on October 10: "SILVER over $50. $75 next? Silver and Ethereum hot, hot, hot." The entrepreneur and investor's $75 target represents a 54% upside from current levels and falls within the range of aggressive analyst forecasts.
Kiyosaki has been consistently bullish on silver throughout 2025, advocating for precious metals as protection against fiat currency debasement and monetary policy uncertainty. His $75 prediction aligns remarkably well with my technical analysis using Fibonacci extensions, which I'll detail below.
SILVER over $50.
— Robert Kiyosaki (@theRealKiyosaki) October 10, 2025
$75 next ?
Silver and Ethereum hot, hot, hot.
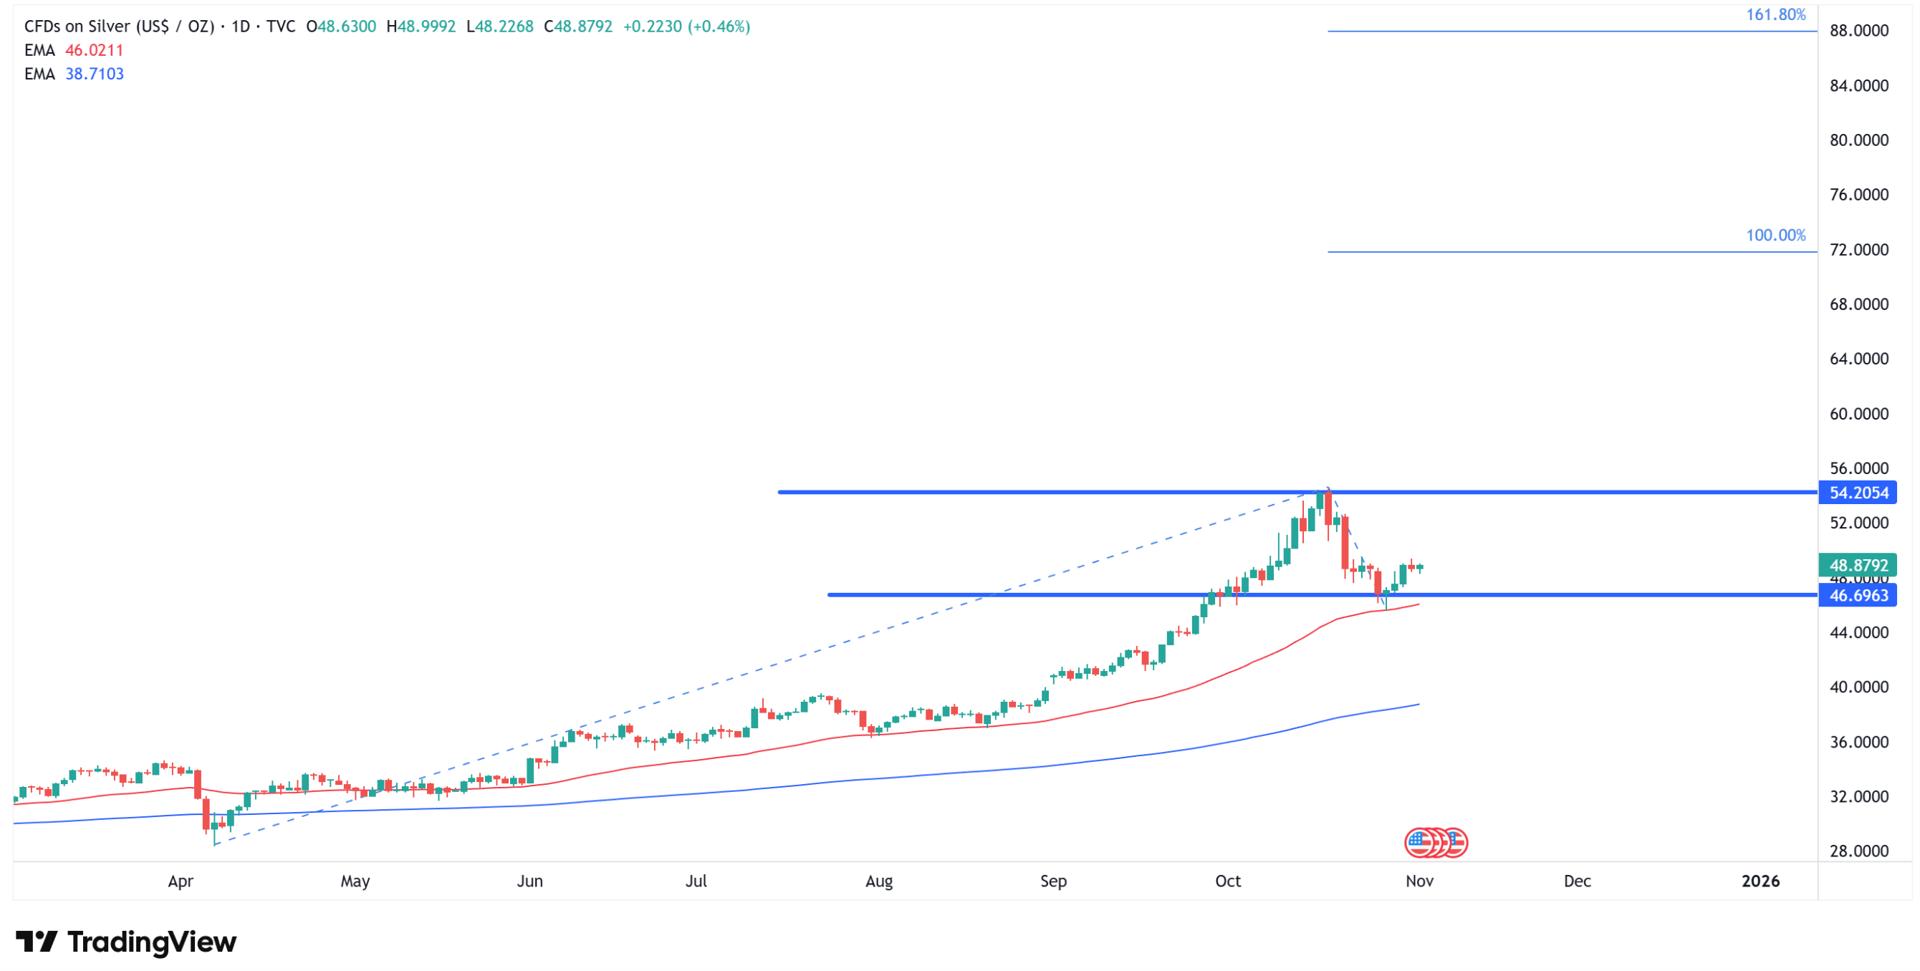
Silver Technical Analysis: Fibonacci Extensions Point to $72-$88 Targets
According to my technical analysis, although nobody possesses a crystal ball, we can use Fibonacci extensions for guidance. These extensions, stretched across the uptrend observed from April lows this year to October highs and the correction from the last two weeks, show that the 100% extension falls around $72, which aligns perfectly with Robert Kiyosaki's predictions of further price increases.
The 161.8% Fibonacci extension lands around $88, which in turn aligns with predictions that silver prices could double in the medium term. These technical projections provide mathematical support for the bullish narratives emerging from fundamental analysts and prominent investors.
The current consolidation between $47-$49 represents a healthy pause after silver's extraordinary 71.9% year-to-date rally. Silver starting the week at $48.83, rebounding from the 50 EMA, suggests the white metal is building a platform for the next leg higher rather than experiencing a trend reversal.
Silver Price Prediction Table
Major financial institutions have published aggressively bullish silver forecasts. Bank of America projects silver reaching a $65 peak in 2026, averaging $56.25 for the year, representing 34% upside from current $48.66 levels.
Institution | 2025 Forecast | 2026 Forecast | Peak Target | Upside % |
Bank of America | — | $56.25 avg | $65 peak | +34% |
CoinPriceForecast | — | $70 end-2026 | — | +44% |
Robert Kiyosaki | $50+ | $75 | — | +54% |
CNBC Analysis | — | — | $100 (post-$50 breakout) | +105% |
Fibonacci 100% | — | — | $72 | +48% |
Fibonacci 161.8% | — | — | $88 | +81% |
According to Traders Union's outlook: "Silver's short-term outlook remains constructive as long as prices stay above $48.00 and the 200-EMA base. The narrow consolidation range between $48.00 and $50.00 reflects a market searching for balance after several volatile sessions."
Before you leave, please also check my previous analyses of the precious metals market:
[#highlighted-links#]
Silver Price Analysis, FAQ
How high will silver go in 2025-2026?
Silver trades at $48.66 after 71.9% YTD rally with institutional forecasts ranging from HSBC's $50-$53 near-term to Bank of America's $65 peak 2026 (+34% upside), Robert Kiyosaki predicting $75 (+54%), CNBC analysis suggesting $100 doubling scenario after $50 breakout, and my Fibonacci technical analysis identifying $72 (100% extension) and $88 (161.8% extension) targets from April-October rally measured from recent two-week correction.
Why is silver rising so fast?
Silver's 71.9% YTD gain driven by gold spillover effect (HSBC: "gains in gold attract ancillary buying in silver" as gold crossed $4,000), London physical market tightness from US tariff-driven flows creating supply constraints, Federal Reserve rate cuts reducing opportunity cost of non-yielding assets, safe-haven demand amid market volatility, industrial demand acceleration (solar panels, EVs), volume surging to 10,227 (10.45x average) indicating institutional accumulation, golden cross formation (50-day MA $44.93 above 200-day MA $36.99).
Will silver hit $50 again this year?
Yes. Silver at $48.66 sits only 2.8% below $50 psychological barrier with Jainam Mehta (Traders Union) noting "sustained move above $49.50-$50.00 could revive bullish momentum," HSBC expecting test of $50 "in near term," RSI at 60.9 showing improving momentum, volume 10.45x average confirming buying interest, though key resistance $48.33-$48.60 (20/50 EMA) must be broken first, with failure to hold $48 risking retest of $47 support before another attempt.
Is silver a better investment than gold now?
Yes. Silver up 71.9% YTD vs gold +55% (silver outperforming), gold/silver ratio 82:1 vs historical 60:1 average (silver undervalued 27% on relative basis). However, silver exhibits higher volatility (50 vol asset requiring larger position risk management), industrial demand provides structural support that gold lacks, but gold remains the primary safe-haven with deeper liquidity for larger allocations.
 Copy Link
 Share on Facebook
 Share on X
 Share by Email
