
USDCAD Technical Analysis – The Loonie remains under pressure amid tariffs risk
Fundamental Overview
The USD is losing ground against the major currencies as the market continues to price in more easing by the end of the year. The market is now expecting three rate cuts by the end of the year which is in stark contrast to just one seen a couple of weeks ago.
The US data recently started to miss expectations by a big margin and the market reacted by adjusting its growth expectations. The Trump’s tariffs policy is also weighing on growth expectations increasing the likelihood of faster Fed easing down the road.
One constraint the Fed might have could come from higher inflation expectations. In case we get a slowdown, the Fed might not be fast enough in cutting rates amid inflation remaining above target and uncomfortably high long-term inflation expectations. This is something to keep in mind in light of the next NFP and CPI reports.
On the CAD side, the economic data out of Canada has been showing gradual improvement and the central bank is now past the peak in dovishness which should further support the CAD. The risk-off sentiment though and the tariffs risk isn’t helping the Loonie which weakened further yesterday as Trump confirmed the 25% tariffs of Canada and Mexico coming into effect today.
USDCAD Technical Analysis – Daily Timeframe
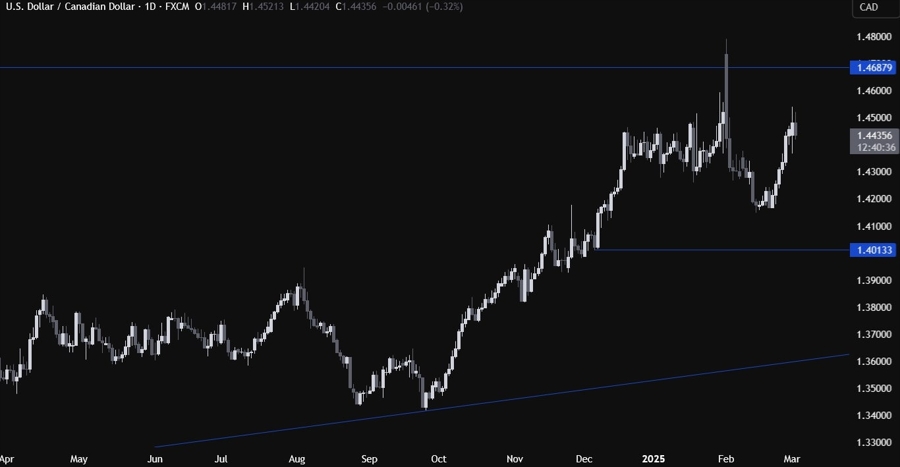
On the daily chart, we can see that USDCAD eventually reached the 1.45 handle amid the tariffs risk. Judging by the reaction to the tariffs news though, it seems like the market is still hopeful for some last minute resolution as the spike higher is getting faded. There’s not much we can glean from this timeframe as there’s been lots of choppiness which makes hard to distinguish the signal from the noise.
USDCAD Technical Analysis – 4 hour Timeframe
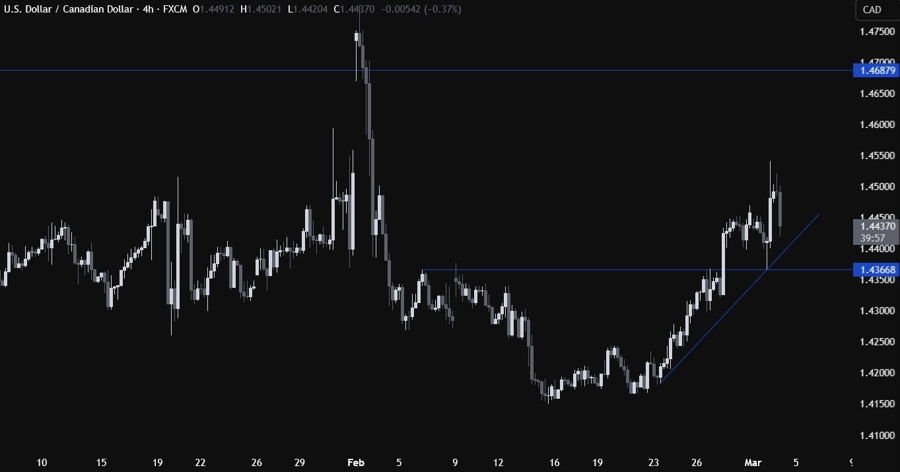
On the 4 hour chart, we can see that we have an upward trendline defining the bullish momentum. The buyers will likely lean on the trendline with a defined risk below the 1.4365 level to keep pushing into new highs, while the sellers will look for a break below the 1.4365 level to gain more conviction and pile in for a drop into the 1.40 handle next.
USDCAD Technical Analysis – 1 hour Timeframe

On the 1 hour chart, there’s not much we can add here as the buyers will look for a bounce around the trendline or the 1.4365 level, while the sellers will look for a break lower to target new lows. The red lines define the average daily range for today.
Upcoming Catalysts
Today the market participants will be on the lookout for tariffs headlines as they go into effect for Canada, Mexico and China. Tomorrow, we have the US ADP and the US ISM Services PMI. On Thursday, we get the latest US Jobless Claims figures. On Friday, we conclude the week with the Canadian Employment data and the US NFP report.
 Copy Link
 Share on Facebook
 Share on X
 Share by Email
